------------------------- 
"Investment is most intelligent when it is most businesslike" B.Graham - The Intelligent Investor
In today's market, choosing the right formula on how to pick a stock to invest in, may sound a bit challenging. Going through the vast world of stock-picking methodologies, one of the most inspiring strategy, endorsed by the majority of individuals and institutional investors is the value investing approach.
What is value investing?
The approach was originally formulated some 60 years ago with the publishing of Graham and Dodd's college textbook "Security Analysis". Graham followed it up with "The Intelligent Investor", which brought his investment philosophy to the masses; Warren Buffett later described it as "the best book about investing ever written". Benjamin Graham is properly credited as one of the "fathers" of value investing.
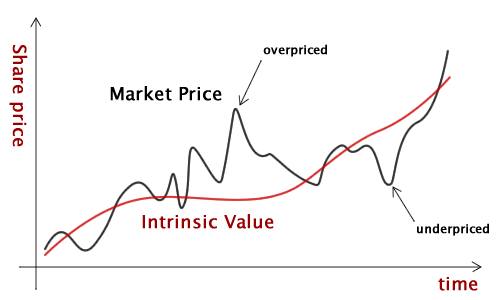
The concept is actually very simple: find companies trading below their intrinsic valuation.
The mentality of those who invest according to the value investing philosophy is to become, through the purchase of stocks, the owner of a business, in relation to the quantity purchased.
The investor, which hold a part of the entire business, will be entitled to get the future earnings of the company owned.
A key feature of this investment technique is related to the fact that investors should not place too much regard to external factors related to the company such as market volatility, daily prices fluctuations or systematic risks related to significant catalyst in the short-term horizons. In fact, the value investor is merely interested in determining the intrinsic value of the selected company and, this is strictly related to the business' quality and its ability to generate growth in the future.
What are the must-have metrics?
Every conscious value investor knows that there's no "right way" to analyze stocks. Primarily, the investor must start to analyze company's financials, execute ratio analysis, estimate the financials and test different scenarios with the purpose of picking the winning stock.
To get some true picture of a company's value, investor should analyze it based on various aspects, but here we want to sump six of the most known criterion in the investment's world.
The six yardsticks are:
- Price-to-earnings;
- Price-to-sales;
- Price-to-book;
- Earnings Yield;
- PEG ratio.
The price-to-earnings (P/E) is calculated dividing stock's share price by its earnings per share. The higher the P/E ratio is, the greater the investors' expectations are about the company's growth. In fact, a high P/E value indicates that the market is willing to pay a lot, given the level of profits, since it believes the company will be able to increase them further. Frequently, given the same financial performance, a lower P/E ratio express a cheap price and may indicate possible undervaluation.
The price-to-sales (P/S) ratio divides the stock's share price by its sales revenue per share. This indicator varies depending on the industry and does not take into account neither the financial nor the debt structure of a company. It's useful to use this indicator when comparing similar companies. A lower P/S ratio may indicate a possible undervaluation." The P/S reflects how many times investors are paying for every dollar of a company's sales." (Investopedia)
The price-to-book ratio (P/B ratio) is the ratio between the stock's share price and the the company's capital value per share resulting from the balance sheet (book value) . The securities sold at a price well below the book value of shareholders' equity are generally considered good candidates for undervalued portfolio; on the other hand, those sold at a higher price than the book value, are the target of overvalued portfolios.
Earnings yield are the earnings per share divided by the current market price per share. It is the reciprocal of the P/E ratio. This quotient express how expensive a company is in relation to the earnings the company generate and allows investors to identify those stocks trading at a bargain price. It's possible to adjust the earnings yield formula to take in account that different companies have different financial debt structure.
Adjusted formula [via Wikipedia]:
Earnings Yield = (Earnings Before Interest & Taxes + Depreciation - CapEx) / Enterprise Value (Market Value + Debt - Cash)The price/earnings to growth ratio (PEG ratio) is the relationship between the price-to-earnings (P/E) and the annual revenue's growth rate a company. If the P/E ratio of a company is higher than its the growth rate, and so the PEG is greater than one, this means that the stock's share price is relatively expensive; vice versa, if P/E is lower than the growth rate, and then the PEG is less than one, this is seen by1 analysts as a sign of favorable purchase. Looking for stocks based on their PEG ratios can be a good way to find companies that are undervalued but growing, and could gain attention in the upcoming quarters.
Backtesting the strategy
Nowadays, there are many software tools out there that provide the ability to backtest our investment strategy before putting our own capital at risk. Using a screening tool, investors are able to filter and research stocks based on the key metrics chosen for their due diligence.
In our case we used a screen, according to the value investing principles, which follows these rules to set our portfolio up:
- price-to-sales ratio less than 0.80: sales revenues should be at least 25% more than the current price value;
- net-margin last five years grater than 5%: looking at a five-year average provides a good sense of how the business usually performs;
- total-debt-to-equity less than 40%: debt is a source of capital but it can be a burden when times turn tough. We look for a well balanced financial structure here;
- return-on-investment last five years greater than 12%: specify how profitable the company is and provide a good picture of the true company's essence;
- free-cash-flow grater than 0: represent the ability of the company to generate cash after spending for all capital expenditure.
- earnings-per-share growth last 10 years greater than 5%: companies that had a higher earnings growth rate in the last 10 years on average.


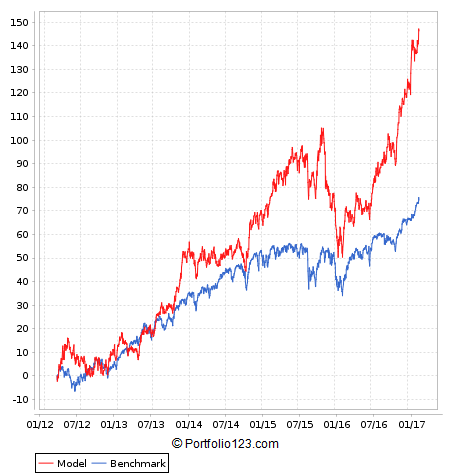
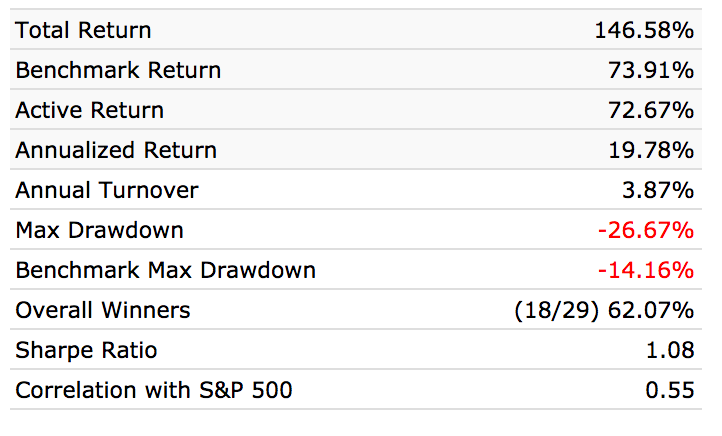
The results of this screening are surprising. We started an equally weighted portfolio on march 3, 2012 with a value of $100,000 and ended on March 03, 2017 with a market value of 246,784.33 for a holding period return of 146.58%. During the same period, the S&P 500 had a return of 73.91% as we can see from the exhibit above. One of the most relevant aspects in our analysis is related to the risk factor. Firstly, the portfolio Sharpe ratio of 1.08 shows that for every 1 unit of risk our portfolio is able to generate 1.08% in excess return compared to an equivalent risk free investment. Also, the Sortino ratio of 1.64 expresses that the variability of returns does not focus predominantly below the minimum acceptable. We can conclude that our investments have a well justified return related to the associate risks.
"Margin of safety": an essential concept of investment
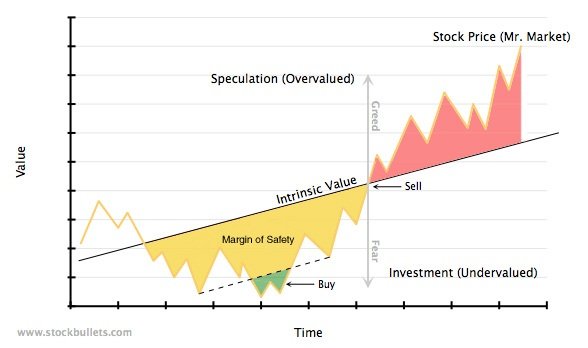
Margin-of-safety are the 3 most important words in investing. All experienced investors recognize that the margin-of-safety concept is essential to the choice of safe bonds and stocks.
Here's an image that explain the concept clearly:

"A margin of safety is achieved when securities are purchased at prices sufficiently below underlying value to allow for human error, bad luck, or extreme volatility in a complex, unpredictable and rapidly changing world." Seth Karman
A simple and easy way to apply the margin-of-safety rule, is to divide the estimated intrinsic value of the company by its current market price. The value obtained, if greater than 1, indicates that the company is undervalued and is sold at a lower current price of its fair value, vice versa, if less than 1, indicates that the company is overvalued and is traded on the market at a higher price of its underlying value.
The Bottom Line
Whenever a person decides to make profits from stock purchases and sales, he is undertaking a business venture of his own, which must be ran in accordance with accepted business principles if he wants to have a chance of success.
As Graham stated the first and the most obvious of these principles is: "Know what you are doing - know your business." A second business principle: "Do not let anyone else run your business, unless you can supervise his performance with adequate care and comprehension." A third business rule is more positive: "Have the courage of your knowledge and experience." - B. Graham
To sum up, for every investor, it means that their operations for profit must be based not on optimism but on arithmetic.
Really nice article, lots of good info thanks. Just wish more of our community would read this so they stop investing in all the enormously overvalued tokens (for example, EOS is near the top of your first chart in my estimation).
Gonna reread this a few times, thanks!
This is all very interesting and relevant on the stock market.
But the question that interests us in the world of cryptocurrency is whether there exist any, even rudimentary models to evaluate cryptocurrencies. Suppose you have a utility token used in a decentralized app used to solve some real world problem. Would it make sense to treat the tokens similarly to stock in a company? What if the token was released by a company that also raised capital on the stock market? I could be wrong but it seems that theoretical work in this field is severely lacking.
What do you think?
Very nice point! I think that right now it is still complex to gauge the impacts of whatever token it is. However, I think that the approach to be used when evaluating an investment in the crypto space should follow the one used in the stock market; this is why I chose to open my article series with the old but gold value investing technique. We should always ask ourselves if the asset is undervalued and especially if it will gain consistent value over time. If both answer are yes, we should consider investing. Do always your own research guys and don't follow the masses. Being contrarian is often the key to be a successful investor. F