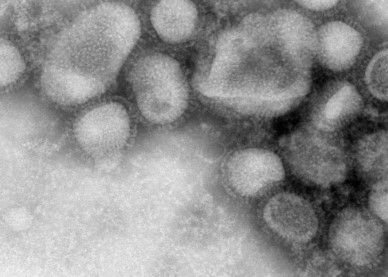
Source- H1N1 free to use image
In my experience, when flu starts to rev up before Christmas it will be a hard and busy season. Couple that with some colder than average weather in the South and the makers of Tamiflu are in for a roaring year.
Follow flu activity from the CDC surveillance site, it runs about a week or two behind as facilities submit positive flu results to their respective state.
Link- https://www.cdc.gov/flu/weekly/index.htm#ILIMap
It's one long webpage, the link takes you directly to the map. From there you can pick your state or region.
Surveillance is done in five main categories:
*Virologic Surveillance- which includes Surveillance for Novel Influenza A Viruses. In total roughly 100 public health and over 300 clinical laboratories located throughout all 50 states and territories submit data.
*Outpatient Illness Surveillance- through the Outpatient Influenza-like Illness Surveillance Network (ILINet) in all 50 states and territories.
For week 49 (December 3-9, 2017) the two highest/most active regions are:
Region 6 — 4.2% - Arkansas, Louisiana, New Mexico, Oklahoma, and Texas
Region 2 — 3.1%- New Jersey, New York, Puerto Rico, and the U.S. Virgin Islands
*Mortality Surveillance- using the National Center for Health Statistics (NCHS) mortality surveillance data and the Influenza-Associated Pediatric Mortality Surveillance System. Note that pediatric data, anyone younger than 18 years of age, is collected separately.
*Hospitalization Surveillance- via the Influenza Hospitalization Surveillance Network (FluSurv-NET). It reviews hospital lab data.
*Summary of the Geographic Spread of Influenza- data is submitted from State and Territorial Epidemiologists Reports in all 50 states and all territories. States and territories report geographic spread of influenza activity as no activity, sporadic, local, regional, or widespread.
I love following this data every year, it's like pandemic come to life.
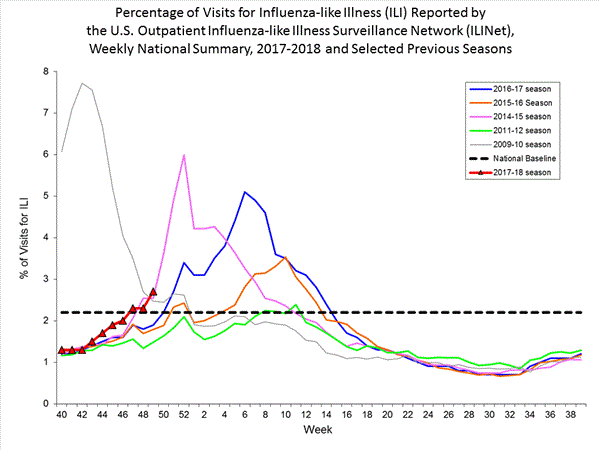
So far, it looks like we are on track to follow the 2014-2015 season-

Source- CDC
There are interactive maps and you can track 'progress' of the flu virus week to week.Weekly CDC link- https://www.cdc.gov/flu/weekly/
Weekly Influenza summary
https://www.cdc.gov/flu/weekly/usmap.htm
Nationwide during week 49, 2.7% of patient visits reported through the U.S. Outpatient Influenza-like Illness Surveillance Network (ILINet) were due to influenza-like illness (ILI). This percentage is above the national baseline of 2.2%. (ILI is defined as fever (temperature of 100°F [37.8°C] or greater) and cough and/or sore throat.)
Some major pharmacy chains also publish data but I prefer to not include them. Firstly, I am not advertising them, secondly their data is from a self selected group, either those who have commercial insurance and/or cash paying customers.
So, wash your hands people and cough into your sleeve.
Oh, and wash your dang hands.
Laters,
platel3t