I've been trying some extra forms of analysis to get an understanding how teams are performing.
Rather than just reading the stats available everywhere i want to dig deeper. I can't look
at a goals scored stat without thinking about, hmmm but how many shots were taken and that leads me down a rabbit hole of thinking well how many shots were taken from how many minutes in possession etc etc.
So i started to breakdown stats into "per minute in possession", people familiar with the film "Moneyball" will understand the concept of digging deeper than the surface stats.
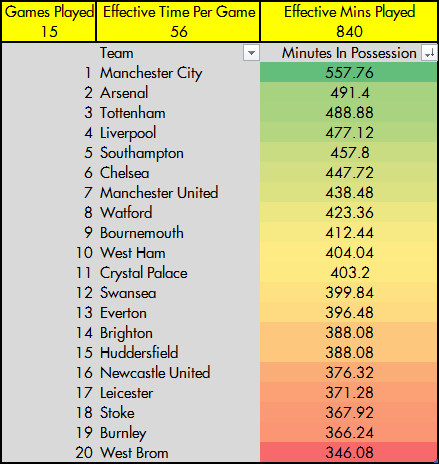
There is a general concesus that the actual time the ball is in play in a soccer match is apx 56 minutes, hence effective time per game. (www.soccermetrics.net, 2013)
From now on MIP will stand for Minutes In Possession
Anyway, here is the minutes in possession after the first 15 games in the premier league followed by my first breakdown, expected shots per game.
Effective Minutes Payed * Total Possession % = MIP
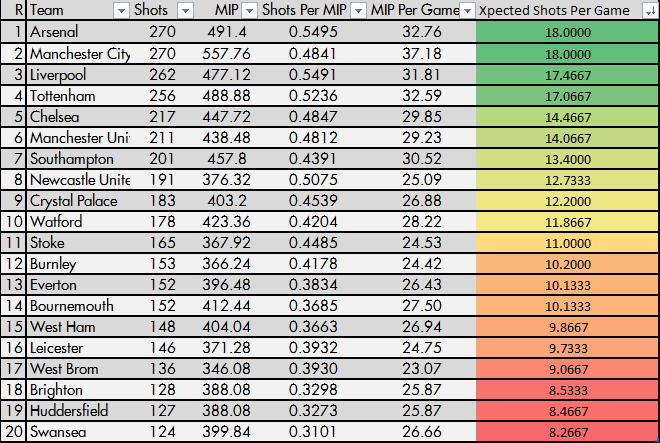
Total shots / MIP = Shots per MIP
MIP / Games Played = MIP Per Game
Shots Per MIP * MIP Per Game = xPected Shots Per Game
xPected Shots Per Game
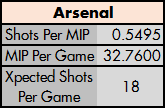
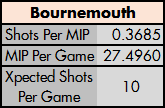
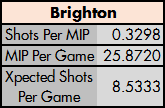
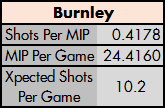
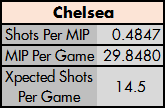
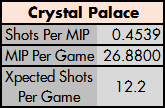
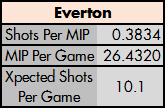
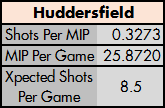
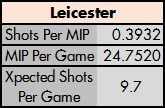
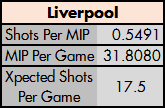
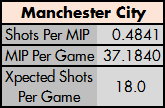
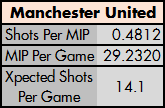
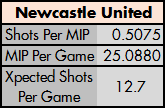
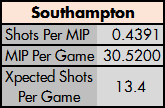
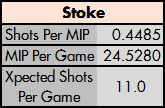
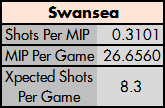
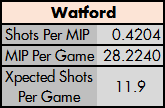
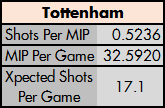
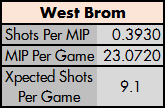
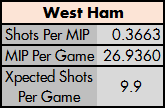
While i gauge interest in this type of analysis i'll post more premier league statistics before the next round of games
Ref: http://www.soccermetrics.net/team-performance/effective-time-in-football