INTRODUCTION
Please read previous post here Forex Useless Analytics GPB/USD Part 1.
ANALYTICS METHOD
Recognizing the market's behavior by analyze candles. Using Boilinger Band, and reading news update for support. But in this post i dont write about how i analyze the market, but just telling you what action i will do from my analytics.
If you have another result, i'm really gladful to hear from you.
2nd Analytics

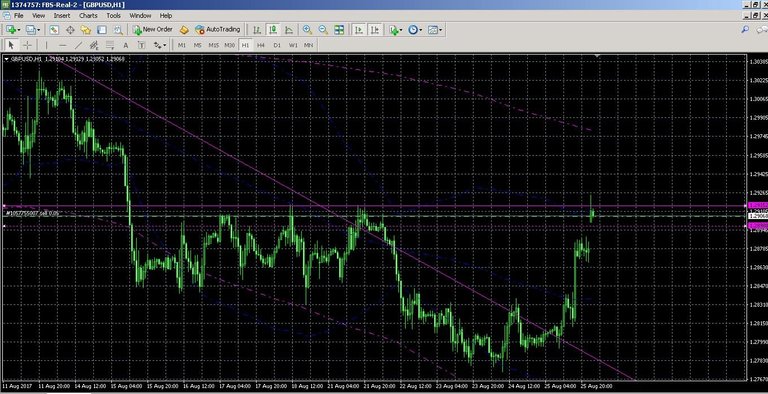
I'm drawing Monthly Trendline (sloping down pink line), Price Barrier (two horizontal pink line), and you can see Monthly Boilinger Band (pink dotted line), and Weekly Boilinger Band (blue dotted line). note: Monthly BB you see is Medium and Lower BB.
You can see the prize is climbing into the Price Barrier and also Upper Weekly BB. This is crytical time to decide whether the price will going up or going down.
In last post i wrote that i'll take a SHORT if monthly price test the Barrier/Weekly BB, and closing inside or below the barrier. But i've already take a short (green dotted line), why? Because the Barrier/Weekly BB has been tested, and weekly price close inside the Barrier. This week is potential for short.
note: we still dont know where monthly price will be closed, it means there's 100 ~ 200pips of loss RISK in my opening. So, better set Stop Loss
So now we have 2 analytics, monthly and weekly. Let's see this month closing. See you next time.
Upvoted and following you. Hope you will also do the same.
Good luck Bro :)