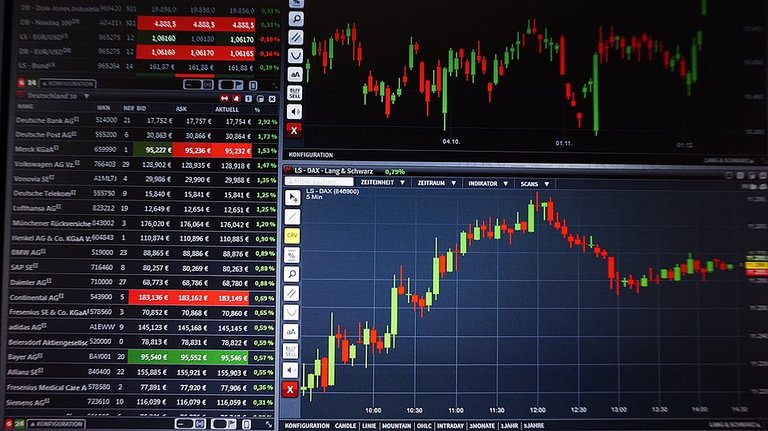
Many traders know what tools are needed for trading using technical analysis. For example indicators on platforms such as Moving Average and Oscillator, or custom indicators that can be installed on their own.
However, often novice traders are still confused about the steps of using technical analysis for forex trading. In this article, we will provide brief instructions to help you use technical analysis as part of the process of learning forex trading.
- Determine the timeframe that will be used
Open the MetaTrader platform, then check the chart on a specific timeframe. Decide on what timeframe you want to trade. If you want to trade in a short period of time, choose the timeframe below daily (D1). Or if you want to open and close trading frequently in a day, please take a H1 timeframe or smaller than that.
- Know market conditions
The most important step in using technical analysis for forex trading is knowing the market conditions. For this, you can't just open the chart and then guess "this will definitely rise". Guesses like that are the way people gamble, not trade.
Forex traders generally use devices such as trend lines, oscillator indicators, or understanding price patterns to determine market conditions and ongoing price movements. This identification is important, because technical indicators and strategies that are applied in trending, ranging, or choppy market conditions can vary.
In order to know the market conditions too, traders can compare price movements on the chart on several timeframes. The goal is to ensure that open positions will not be crushed by movements on different timeframes.
- Select technical indicators
Based on the consideration in the previous two points, the next step to using technical analysis is to choose indicators that are appropriate to market conditions.
If the market is trending, it will be of little use to the RSI. Price movements with high volatility can be smoothed with the Moving Averages crossover. Conversely, if the market is sideways, then Moving Averages will not be much useful. Can also choose indicators based on the characteristics of the pair traded. For example if trading commodity currencies whose movements often follow certain cycles, the Commodity Channel Index (CCI) could be an option.
Indicators can be installed easily on the trading platform that has been obtained from the broker. Just click the "insert" menu, then you can see a variety of indicator options. Just click on one of the indicators, then it will appear on the chart, right on the selected timeframe.
Basically every trader can process their own indicators which will be used, based on their respective understanding. Of course if you do not know any indicators, it is better to study one by one. Next, combine these indicators to be applied in a forex trading system that is simple and easy to use.
- Modify the indicator
We can use technical analysis based on the default settings (as they are) as seen on indicators that already exist in the trading platform. However, many traders can actually be superior because they take the time to customize periods and other inputs to the indicators they use.
The method is very easy. On the chart that you are using, right-click, select "Indicators List". Then a window will appear containing the indicators that have been posted on the chart. Select which indicator will be modified. Next, click "edit" on the right, then change the numbers in the window that appears after that.
- Look for trading signals
After technical indicators are installed and established, the next step is certainly to look for trading signals. Signal is a trading opportunity that arises from the movement of the price of pair-pair on the market.
What kind of signals do traders look for? Signals can arise from interactions between prices and indicators, as well as the relationship between indicators. In this case, "using technical analysis" means not just trading after knowing market conditions, but also confirming the signal first. If the price enters oversold or overbought levels, for example, before opening a position, first make sure there is divergence. Then if there is a breakout on the market, then you can try to confirm it with a crossover.
Generally, there are five types of trading signals when you trade using technical analysis:
Channels
Channels are formed from two parallel trendlines that cover price movements from two different directions. Usually used to identify a breakout or potential trading.Crossover
Crossover occurs when one indicator band with a certain value crosses the indicator band with a different value, where it signals a change in momentum. Crossover can be obtained by installing several Moving Average with different periods above the chart, or from different band crossings on the Oscilator. As can be seen in the circled section in the chart screenshot below. There are some crossover between the three Moving Averages, each with periods of 20, 60 and 100, on the EUR / USD H1 chart.
Divergence
Divergence occurs when prices and oscillator indicators move away from each other. For example, if the price falls to a new low level, but the oscillator rises even higher, then it could signal a reversal of the downtrend to an uptrend.Breakout
Breakout occurs when prices move past a certain level, the highest or lowest level in a certain period.Price Patterns, such as triangle, flag, head and shoulders, etc.
- Analyze the results obtained, then trade execution
With all the tools that have been implemented, you can now use technical analysis. Note the signals that appear and confirm. Separate which strong signals can be executed with the most optimal profit potential, which signals are weaker, which ones are too high, and so on.