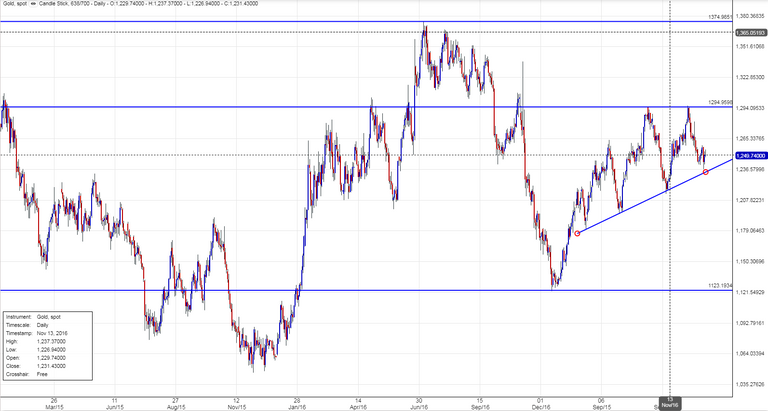
After having a look at the daily chart of gold, I think that in the short term the prevailing risk is to the downside. While price stays below $1270 we might see another run on the support provided by the rising trend line which sits at roughly $1235 right now.
A break below this level will quickly lead to a test of the $1214 level, representing the neckline of the $1295 double top. If this level fails to provide support, then gold will experience a sharp drop towards the December 2016 lows ($1223).
On the upside if gold manages to climb above $1270 level we should soon witness an attempt to break the $1295 resistance and clear the $1300 psychological level.
Note: This is not intended as financial advice!
Image: chart
Peace, Abundance, and Liberty Network (PALnet) Discord Channel. It's a completely public and open space to all members of the Steemit community who voluntarily choose to be there.Congratulations! This post has been upvoted from the communal account, @minnowsupport, by recreator from the Minnow Support Project. It's a witness project run by aggroed, ausbitbank, teamsteem, theprophet0, and someguy123. The goal is to help Steemit grow by supporting Minnows and creating a social network. Please find us in the
If you like what we're doing please upvote this comment so we can continue to build the community account that's supporting all members.