0x0 概要
- 基本情况 近期遇到一些小伙伴在询问加密资产(币圈)量化到底是什么?怎么自动交易的?所以干脆自己抛砖引玉弄点小例子说明一下。其实目前阶段如果说图形技术派的量化自动交易,其实与传统金融方法差异不大(参考外汇,期货交易),都是那些指标,那些因子。当然基本面量化分析,与传统金融分析方法,指标以及信息采集方法差异很大。以前加密资产其实没有严格意义基本面分析范式,但是这一两年从NFT大量差异化衍生,反而造就一批一批基本面调研方式与方法。从而又衍生出来一些工具,造就了可以指标性量化以及工具化获利(其实目前我在对基本面分析方法在摸索方面,今天文章还是主要讲图形技术派传统金融方法)
- 工具 工欲善其事,必先利其器。现在加密资产可以用到工具有很多比如
CCXT。但是很多新手玩家来说,这些工具不是十分友好。有不有类似聚宽那种带可视化的呢。有!那就是发明者https://fmz.com/。主要这个平台可视化方便,简单回测方便。下面主要以FMZ平台为例说下。如何获取行情数据,然后转换为入市信号,并通知到自己邮箱。
0x1 操作
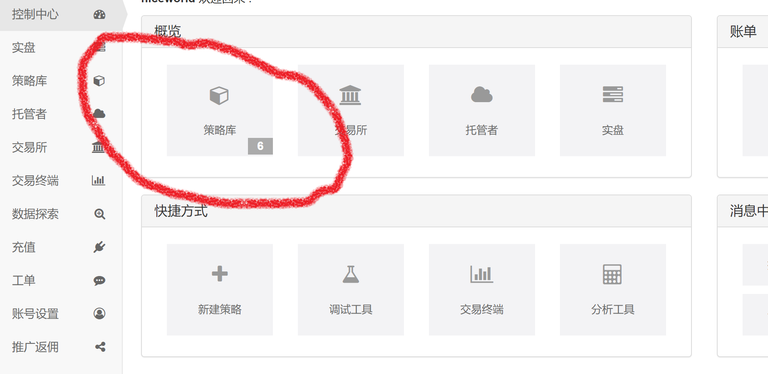
- 注册平台
- 进入策略
- python代码
'''backtest
start: 2023-12-02 00:00:00
end: 2024-03-04 00:00:00
period: 1h
basePeriod: 15m
exchanges: [{"eid":"Binance","currency":"BTC_USDT"}]
'''

def main():
    tm = 0
    while true:
        if tm == 60: #1分钟执行一次
            getboll()
            tm = 0
        Sleep(1000) #休息一秒
        tm+=1


def getboll() : #信号捕捉模块
    records = exchange.GetRecords(14400) #获取K线周期为4小时的K线数据
    if records and len(records) > 20 :
        boll = TA.BOLL(records, 20, 2.5) #将K线数据转换为boll带数据
        upLine = boll[0]
        midLine = boll[1]
        downLine = boll[2]
        price = exchange.GetTicker().Last
        if price > upLine[len(upLine) - 1] : # 对比成交价与boll上轨线
            sendtomail("卖出信号", "价(格:" + str(price) + "大于BOLL上轨线:" + str(upLine[len(upLine) - 1])) #发送邮件
            Log("卖出信号:" + "价格:" + str(price) + "大于BOLL上轨线:" + str(upLine[len(upLine) - 1]) + "@") #打印信号信息
        elif price < downLine[len(downLine) - 1]:
            sendtomail("买入信号", "价格:" + str(price) + "小于BOLL下轨线:" + str(downLine[len(downLine) - 1]))
            Log("买入信号:" + "价格:" + str(price) + "小于BOLL下轨线:" + str(downLine[len(downLine) - 1]) + "@")
    return 0


def sendtomail(title, body):
    Mail("smtp.163.com", "[email protected]", "password", "[email protected]", title, body) #设置邮箱信息
- javascript代码
/*backtest
start: 2024-10-01 00:00:00
end: 2024-10-28 00:00:00
period: 1h
basePeriod: 15m
exchanges: [{"eid":"Binance","currency":"BTC_USDT"}]
*/

function main() {
    let tm = 0;
    while (true) {
        if (tm == 60) { //1分钟执行一次
            getboll();
            tm = 0;
        }


        Sleep(1000); //休息一秒
        tm++;
    }
}

function getboll() { //信号捕捉模块
    var records = exchange.GetRecords(14400); //获取K线周期为4小时的K线数据
    if (records && records.length > 20) {
        var boll = TA.BOLL(records, 20, 2.5) //将K线数据转换为boll带数据
        var upLine = boll[0]
        var midLine = boll[1]
        var downLine = boll[2]
        var price = exchange.GetTicker().Last
        if (price > upLine[upLine.length - 1]) { // 对比成交价与boll上轨线
            sendtomail("卖出信号", "价格:" + price + "大于BOLL上轨线:" + upLine[upLine.length - 1]) //发送邮件
            Log("卖出信号:" + "价格:" + price + "大于BOLL上轨线:" + upLine[upLine.length - 1] + "@") //打印信号信息
        } else if (price < downLine[downLine.length - 1]) {
            sendtomail("买入信号", "价格:" + price + "小于BOLL下轨线:" + downLine[downLine.length - 1])
            Log("买入信号:" + "价格:" + price + "小于BOLL下轨线:" + downLine[downLine.length - 1] + "@")
        }

    }
    return 0;
}

function sendtomail(title, body) {
    Mail("smtp.163.com", "[email protected]", "password", "[email protected]", title, body) //设置邮箱信息
}
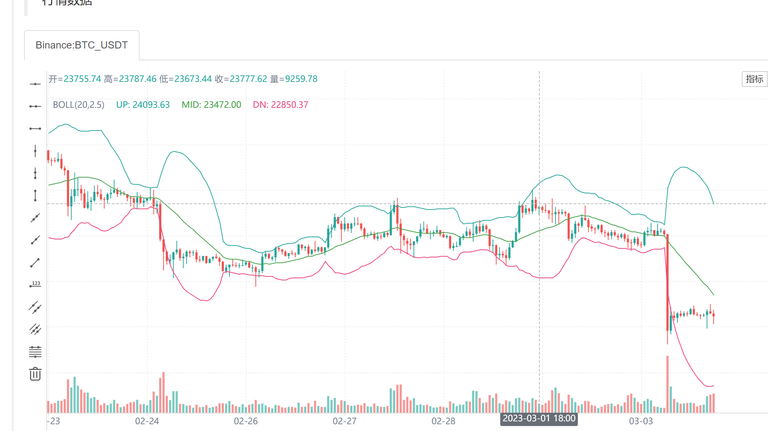
- 回测图像情况
- 回测信息打印情况


0x2 简单说明
- 系统 通常一个简易量化系统,包含了信号模块,执行模块,风控模块。今天只是简单弄了一下信号模块。
- 信号指标 这个指标主要利用的是
BOLL。通过获取4小时K线数据,然后转换为周期20,带宽为2.5的BOLL指标(boll指标主要通过统计学标准差,来设定的,周期20-30,带宽通常值一般为2-3,这里主要利用正态分布的统计为依据,小伙伴可以查查原理)。这儿假设的如果成交价超过上轨线为卖出信号,成交价低于下轨线为买入信号。这儿主要就是一个例子,并不是实战的信号的系统。
0x3 后记
- 主要介绍一下如何获取行情,并将行情转变为信号指标。
Congratulations @darknightlive! You have completed the following achievement on the Hive blockchain And have been rewarded with New badge(s)
Your next target is to reach 50 upvotes.
You can view your badges on your board and compare yourself to others in the Ranking
If you no longer want to receive notifications, reply to this comment with the word
STOPCheck out our last posts: