Hi Everyone,

Welcome to the first post in my conference and journal paper post series. This series will contain ten conference and journal papers from my time working in the Queensland Government. In my post, My Peer Reviewed Conference and Journal Papers, I explain the purpose of this series.
Advanced Methods of Evaluating Benefits from Improved Flood Immunity in Queensland was my first published paper. The Australasian Transport Research Forum first published the paper in 2011, and the Journal of Civil Engineering and Architecture published it in 2013. I presented the paper at the Engineering Technology Forum and the Australasian Transport Research Forum in 2011.
This paper received considerable exposure at the time. At the end of 2010 and early 2011, Queensland was hit by extensive flooding. Pressure was mounting to do something about these floods. Current methodology to assess flood immunity projects was limited and imprecise. My paper offered a methodology that could be used to assess flood immunity and resilience programs and strategies. However, my methodology required the Queensland Government to shift from focusing on projects to programs and networks. This was not compatible with the funding models that focused on one project at a time.
As time passed, addressing flooding became less of a priority. My flooding methodology was discarded. In 2014, I wrote the draft flooding section of the new National Guidelines. The release was put on hold for several years. Eventually, my contribution was completely removed and replaced with the previous project-focused methodology.
Advanced Methods of Evaluating Benefits from Improved Flood Immunity in Queensland
Abstract
The regular occurrence and the high costs of flooding to both road agencies and communities is a strong impetus to investigate the methodologies applied to evaluating flood immunity road projects. Very little literature exists on methods of evaluating the benefits of improving flood immunity through better road infrastructure. This paper attempts to address some of the numerous issues hindering the accurate evaluation of flood immunity road projects. The methodologies presented in this paper are designed to evaluate benefits that are not normally included or not fully considered in evaluations. The application of these methodologies is demonstrated in an example of a typical rural network subjected to regular flooding.
1. Introduction
Roads in rural Queensland are frequently subject to flooding. The accurate prediction of the occurrence of these floods is not always possible as Queensland frequently experiences unpredictable weather. Flooding can potentially cause millions of dollars of damage to road infrastructure (Earth Science Australia 2010) as well as millions of dollars worth of damage to the economy and society (Geoscience Australia 2010). The severe flooding in early 2010 cost Transport and Main Roads (TMR) over $110 million in damages across all regions (TMR 2010a). Prior to floods in late 2010 and early 2011 more than 15% of Queensland State projects were Natural Disaster Relief and Recovery Arrangements (NDRRA) and most of these projects involve treating roads damaged by flooding (TMR 2010b). Preliminary estimates of the total costs to road infrastructure of the late 2010 and early 2011 floods are expected to be close to $4.5 billion (ABC 2011). TMR 2011a have identified 36 sites along the Bruce Highway1 between Brisbane and Cairns that flood during major flooding events. Four of those sites resulted in road closures of over 5 days in the recent 2011 floods.
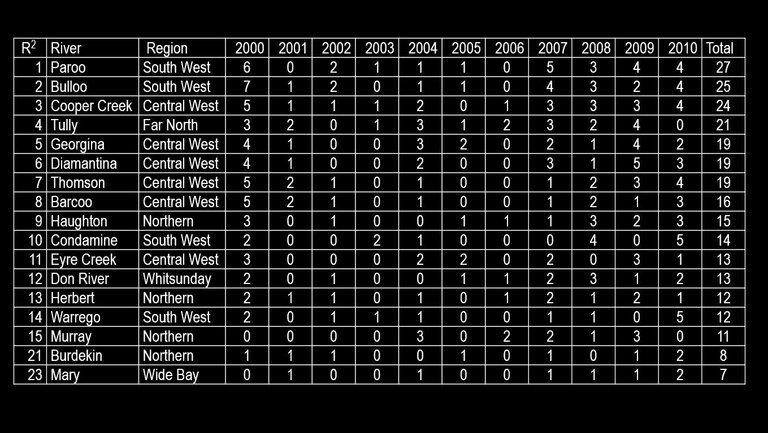
The areas most impacted by floods are the South West, Central West, Far North and Northern Regions of Queensland. Table 1 contains the rivers that have flooded most frequently and the number of times they have flooded between 2000 and 2010.
Table 1: Flooding Frequency of Rivers in Queensland
Source: adapted from Bureau of Meteorology 2011
The flooding of the Tully, Haughton, Herbert, Murray and Burdekin rivers can cause road closures along the Bruce Highway in the Northern Region, while the flooding of the Mary River can cause road closures along the Bruce Highway near Gympie (Population: 42,820 (ABS 2010)) and Maryborough (Population: 21,501 (ABS 2007a)) possibly significantly reducing access to highly populated areas. The flooding of the Warrego River can cause reduced access to Charleville (Population: 3,728 (ABS 2007b) from the north. The flooding of the Thomson, Barcoo, Diamantina and Georgina rivers as well as the Eyre and Cooper creeks can cause road closures along the Barkly and Landsborough highways, which form an important freight route between Mount Isa (North West Region) and Longreach (Central West Region). The flooding of the Paroo and Bullo rivers can cause road closures of the developmental roads connecting the small towns of Quilpie, Thargomindah, Eromanga and Eulo.
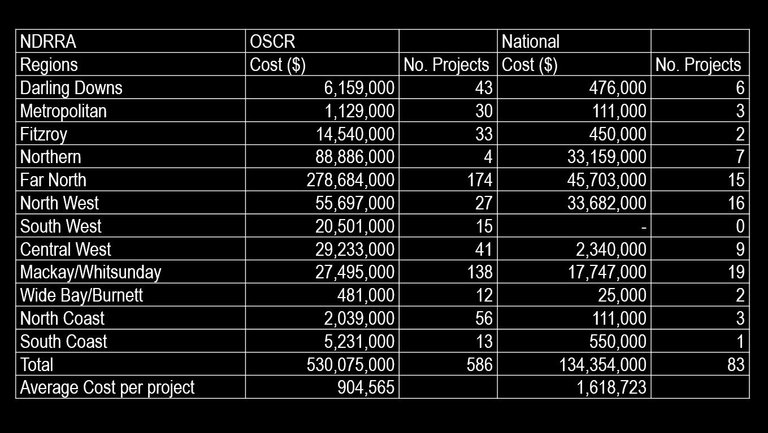
The projected NDRRA costs on state controlled and national highways from 2010 to 2014 according to (TMR 2010b)3 are given in Table 2.
Table 2: Projected NDRRA Costs for the Next Five Years Prior to the 2011 Floods
Source: TMR 2010c RIP Live accessed 17 November 2010
Queensland’s northern regions are expected to experience the highest flood related road infrastructure costs. Most of these costs can be accredited to the severe flooding in these areas in recent years; improving flood immunity will greatly reduce these costs in the future.
Flood immunity projects are difficult to evaluate, very little literature exists pertaining to the methods of evaluating these projects. This paper proposes some feasible methods of assessing the benefits and costs associated with improved flood immunity. To demonstrate how these methods can be applied, an example of a bridge upgrade has been included in this paper. The methods suggested in this paper can help decision makers prioritize flood immunity projects by identifying which road closures are more costly.
2. Issues
The evaluation of a flood immunity project involves the consideration of many factors. These factors can vary in complexity depending on the location of the project site and extent of the network. The collection and organisation of data often poses the largest and trickiest part of evaluating a flood immunity project. The analyst is confronted with a number of issues, one such issue is the determining of which data is relevant. This issue cannot be easily addressed as the data required depends on the detail and the methodology applied to the evaluation. Sources of data are not always available, thus, forcing the analyst to either simplify the evaluation or make assumptions. This section of the paper identifies relevant issues relating to networks, key evaluation parameters, interrelated projects, flood related accident costs and wider economic benefits.
2.1. Networks
The network plays an essential role in the evaluation of flood immunity projects. Good knowledge of the network enables a more accurate prediction of the benefits obtained from an improvement in flood immunity. Important aspects of the network that should be considered are the size of the network, the existence of alternative routes, the types of vehicles that can access these routes and the types of vehicles utilizing the network.
When encountered with a flood, the road user normally has three options, divert, wait or not travel (TMR 2010d). The decision of which option to take depends on which option the road user deems to cost4 the least. If floods can be anticipated, the road user is more likely to select an optimal strategy during the flood, thus making the prediction of road user behaviour easier to make. If the flood is unanticipated, road user behaviour is less likely to be optimal and road user costs will be higher during a flood (Cernaianu 2010).
In the case of an anticipated flood, the analyst should obtain the optimal road user response to flooding (TMR 2011b). The factors, which influence this response, are the road user’s value of time, the flexibility of travel options5 , the duration of the road closure, the length of the diversion route if a diversion route exists, the type of vehicle the road user is driving and any other factors particular to the road or network. Data may or may not be available for all these factors and in these cases, the analyst may wish to exclude the factor or make some assumptions to its value.
In the case of an unanticipated flood, the analyst could still proceed in determining the optimal road user response but consider this response as a best-case scenario. Additional factors need to be considered such as the impact of imperfect information about durations of road closures and the most appropriate diversion routes considering other roads may have also been impacted by the flood. In the case of unanticipated flooding, sensitivity analysis around possible road user behaviour could improve the robustness of the evaluation.
Some routes will attract road users with a higher value of time. These routes are likely to have a high percentage of commercial vehicles. Depending on the type of business located in the region, commercial vehicle road users could value time very differently depending on the urgency of the journey. If the flood can be anticipated, the road users with a high value of time can either travel before or after the floods arrive. If the flood is unanticipated, the timing of journeys cannot be easily changed. Considering this logic, the road user costs of unanticipated flooding are likely to be higher than the costs of anticipated flooding.
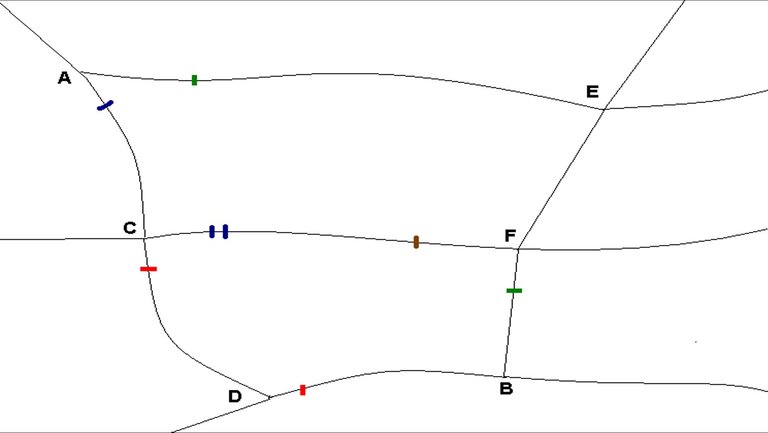
The length of the diversion route plays a significant role in determining the behaviour of the road user. Long diversion routes that add to the cost of the journey are unattractive and may cause more road users to wait or not travel. In some cases, diversion routes do not exist at all, forcing road users to wait or not travel. Some networks allow for multiple diversion routes, which change depending on the extent of the flooding and mass limits of the roads. Figure 1 is a mud map of a simple rural network with multiple possible diversion routes.
Figure 1: Simple mud map of a road network
Legend
Red Lines – Q2 Bridges/Culverts
Brown Lines – Q10 Bridges (mass limit 20 tonnes)
Blue Lines – Q20 Bridges
Green Lines – Q50 Bridges
Route ACDB is the fastest route between Towns A and B but unfortunately approximately every 2 years the sections CD and DB are closed because of flooding. The route ACFB is the next fastest route but a bridge along section CF has a mass limit of 20 tonnes. Therefore, heavy vehicles will divert using the route AEFB, which is considerably longer than ACDB. The route ACFB may also be flooded on occasions as section CF is closed 1/5 the time CD and DB are closed. Route AEFB will rarely flood, thus, providing road users with a reliable route from A to B.
Anticipated floods will not create a great disturbance to this network as viable diversion routes exist for road users who wish to travel or if trips are more flexible, road users can reschedule trips to periods before or after the flooding. Unanticipated floods could cause a greater disturbance to this network. Some road users may need to backtrack to Town B if the bridge along DB is impassable. Road users may not know if route ACFB or AEFB should be taken if information is not available to whether the bridge along CF is passable, thus, causing further delays. Town D could be isolated from the rest of the network without important resources. The costs to isolated towns or communities are not fully recognized in TMR cost benefit analysis methodology.
2.2. Key parameters and their impact on project benefits in currently practiced TMR cost benefit analysis
Many flood immunity projects do not have enough quantifiable benefits when analysed with currently practiced cost benefits analysis approaches. The four key determinants of quantifiable benefits for flood immunity projects are annual average daily traffic (AADT), annual average time of closure (AATOC), average duration of closure (ADC) and the length of the diverting route.
AADT is a key determinant of benefits in all road project evaluations. A road with an AADT of 10,000 vehicles will have fifty times more benefits than a road with 200 vehicles assuming ceteris paribus. Flooding is predominantly an issue in rural areas where AADT is normally low. The benefits per vehicle maybe large but if the AADT is low, the overall benefits will not cover the costs of building a bridge or culvert to reduce road closures.
The AATOC is a parameter unique to projects involving road closures. The number of hours a road is closed has a large impact on the total benefits of the project. The benefits normally captured in a cost benefits analysis are the immediate benefits of reduced road closure times. These benefits come in the form of reduced waiting time, reduced vehicle operating costs (VOC) and reduced travel time cost (TTC). Costs of not travelling during a road closure and the long-term growth of communities are excluded from analysis. A standard AATOC is normally applied to all vehicle types. In reality, road closure times can vary depending on the vehicle type. A road may have a load limitation for a period of time (‘dry-back’ period) after the road has been reopened to cars (TMR 2010d). This load restriction imposes a cost on heavy vehicle road users that is often not considered.
The ADC is another parameter unique to projects involving road closures. The ADC can have a large impact on the overall benefits of a project as the ADC influences road user behaviour. If road closures are long, a higher percentage of road users will either divert or not travel. If the road closures are short, more road users will wait for the roads to re-open. This behaviour will vary depending on the extent of information available regarding the duration of the road closures. If flooding is anticipated, the durations of the road closures are likely to be known and road users will act more efficiently. If the flooding is unanticipated, road users may choose less efficient options.
The costs per road user during an anticipated road closure are likely to decrease as road user’s shift from not travelling to diverting as diversion routes become more viable and then as the duration shortens road users will switch from diverting to waiting.
Figure 2: Possible road user behaviour during a road closure
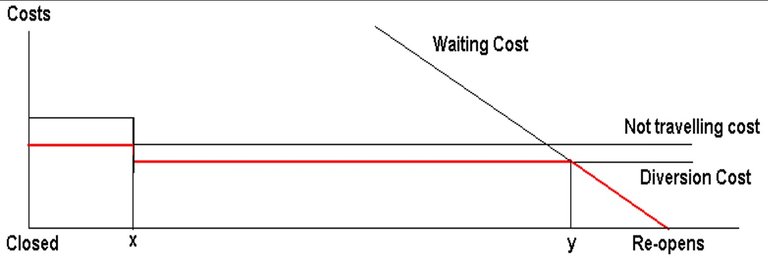
Shown in Figure 2 is an example of a possible cost structure to a road user depending on when the road user encounters a road closure. Initially, the road user would not travel, as the cost of diverting is higher than the value of the journey to the road user. After duration of x, an alternative diversion route becomes available; the cost of taking this diversion route is less than the cost of not making the journey6 . The road user will choose to travel along the diversion route until the cost of waiting and the cost of the journey along the original route is less than the cost of travelling along the diversion route. The red line in Figure 2 illustrates the road user’s optimal behaviour, as the road becomes closer to re-opening.
In the case of an unanticipated flood, the duration of closure is uncertain and alternative routes are uncertain. The parameters in Figure 2 can therefore be roughly estimated, and are likely to be inaccurate. This inaccuracy will cause road users to make inefficient choices, thus resulting in higher costs per a road closure. Currently practiced cost benefit analysis will not accurately detect these inefficiencies.
Another key determinant of overall benefits for a flood immunity project is the length of the diversion route. Long diversion routes could greatly increase the costs of road closures, if the ADC is long. A further complicating issue is that diversion routes could change depending on the extent of flooding. If the flood is small and localised, the diversion route could be short as other roads are not flooded. If the flood is large and covers a large area, the diversion route could become longer or no longer exist if the entire local network is flooded. Determining the diversion routes to use in the evaluation can be complicated and often the shorter diversion routes are selected, thus the additional costs of diverting during larger floods are negated7 .
2.3. Interrelated projects
If one part of a network is inundated, it is likely that other parts of the network are also inundated. It is possible that other flood immunity projects will be proposed to resolve flooding in other parts of the network. When a project is first suggested, the diversion route may be large but this diversion route could be significantly reduced when another route is upgraded.
Another important aspect that should be considered is the flood immunity along the entire route. Improving the flood immunity on one part of the route may only improve the flood immunity of the entire route to a certain extent. Other sections of the route could still be prone to occasional flooding. This other section of the route may be upgraded later. The uncertainty surrounding this could make evaluating the current flood immunity project difficult, thus invoking the use of even more assumptions. The optimal choice of diversion route may or may not be changed by the upgrade of the other part of the route.
Figure 3: Mud map of an example of project dependency
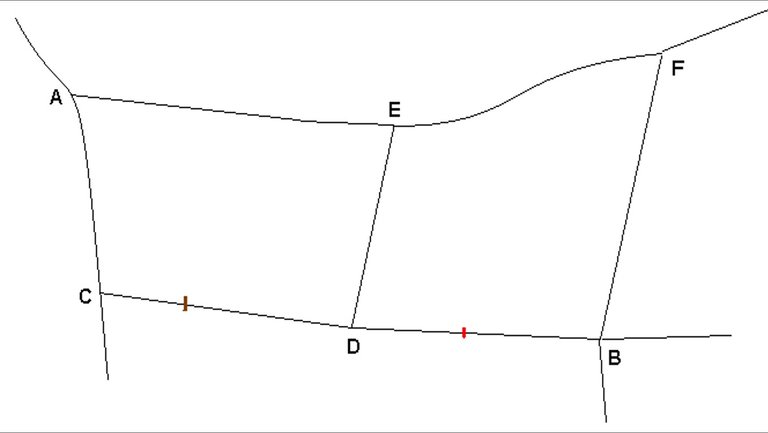
If we assume the same legend applied to Figure 1 is applied to Figure 3, the diversion route in the base case is AEFB for road users travelling between Town A and B. We can see that on average CD is flooded every 10 years. This is inconsequential in the base case for vehicles travelling between Town A and B, as whenever CD is flooded DB is also flooded. In the project case, if the bridge along DB is upgraded to a Q50 bridge8 , the flooding along CD becomes relevant, as ACDB, the shortest route, is not always viable; therefore, the route AEDB is taken instead.
2.4. Flood Related Accidents
From 1788 to 1996 at least 2,213 people have died as a result of over 926 recorded floods (Coates 1999). According to Ashley and Ashley, 2008, 63% of flood fatalities occur in vehicles. Jonkman and Kelman, 2005, identified that 33% of all flood related activities involved drowning in vehicles, most of these occurred because road users attempted to cross flooded roads. If we apply these rates to the fatalities that occur in Australia, approximately an average of 1.5 people die in their vehicles and approximately an average of 0.75 people die crossing flooded roads per flood. Improving flood immunity would decrease the occurrence of these fatalities.
2.5. Wider Economic Benefits
Flooding reduces road access and therefore will likely reduce the economic growth of regions isolated by floods. Improved flood immunity may generate traffic that will directly benefit from improved access. This generated traffic will likely produce wider economic benefits to the community. Department for Transport (2006) has conducted extensive research into wider economic benefits in general. Wider economic benefits of improved flood immunity could be substantial and should be considered for further research.
3. Approach
To overcome some of the issues discussed in the previous section, this paper offers some approaches and methodologies. The extent these approaches can be applied depends on the network and the necessity of a detailed analysis. This section also explains how these same methodologies can be applied to determine which roads are more feasible for flood immunity upgrades.
A simple mud map of the network can be used to ascertain the extent of the network to be analysed. The mud map only needs to contain the network of roads that are likely to be flooded and the diversion routes that road users are likely to use during a flood. Figures 1 and 3 are examples of such mud maps. All sections of the mud map, which are prone to flooding, should be identified. Data should be collected on the extent of the flooding and types of flood immunity treatment that these sections have received or are proposed to receive.
With the use of relevant data and mud maps, diversion routes can be determined based on the extent of the flooding. Road and traffic parameters need to be established for the diversion routes. Once all the available information is gathered, an informed decision to the exact approach can be made. Complete information will enable a detailed analysis, while incomplete information may require assumptions to be made or the analysis could be simplified to cater to the information available.
3.1. The Model
A flooding model has been constructed to estimate the costs of flooding to road agencies and road users. This model expands upon the current methodology applied to flood immunity projects. This model attempts to address most of the deficiencies in the current model. This model is intended to work in synchronisation with current CBA models by applying the values per vehicle kilometre travelled (VKT) derived from these models. The issues addressed in the flooding model are those of network impacts, unanticipated flooding, underestimated flooding benefits, accounting for different diversions routes by different vehicle types, flood related accidents and assessing the impact of interrelated projects.
The road agency costs applied to this model are the costs to the road agency to restore the road to an acceptable standard. These costs are averaged and allocated annually. Road user costs are the standard costs for road closures (diverting, not travelling and waiting costs). These costs are calculated across the network for each route for various severity of flooding. Severity of flooding has been categorized as minor, moderate and major according to the Bureau of Meteorology cited by Attorneys-General’s Department (2009). Each category has been divided into anticipated and unanticipated flooding.
The model requires TTC and VOC outputs per VKT per route from conventional cost benefit analysis models. Considering the potential number of routes impacted by flooding, the model does not endogenously calculate TTC and VOC; these values can be entered directly into the flooding model. The length of the original route and the diversion route are required to determine the additional costs of diverting. The ADC is used to determine the costs of waiting for the road to re-open during a road closure. In the case of an unanticipated flood, road users are assumed to have imperfect information about the duration of closure. To account for the imperfect information, an upper and lower bound of the expected duration of road closure have been incorporated into the model. The maximum cost a road user is willing to pay to make a journey9 is used in the model to estimate the elasticity of demand the road users have for travel along the route. The additional costs of diverting, the duration of closure and maximum cost a road user is willing to pay to make a journey are used to determine the road user behaviour during a flood.
3.2. Calculation of road user behaviour and flooding costs
Figure 2 presented a relationship between the duration of the road closure and road user behaviour. The flooding model is used to calculate the optimal road user behaviour given perfect (anticipated flood) and imperfect (unanticipated flood) information. Road user behaviour given perfect information can be assumed to be optimal. Road users will select the option that minimizes their perceived costs. To derive this behaviour, perceived costs of diverting, waiting and not travelling need to be estimated. Costs of diverting are TTC, VOC, accident and externality. TTC are normally accepted as perceived costs (ATC 2006), VOC are accepted by some as perceived and not by others, accident and externalities are not normally considered perceived. For the purpose of this model, TTC and VOC are assumed to be perceived. TTC and VOC per vehicle are calculated by equations 1 and 2 respectively.
Equation 1: Additional TTC of Diverting

Equation 2: Additional VOC of Diverting

TTCDiv = Additional TTC per vehicle for diverting
TTCkm(DR)/(OR) = TTC per kilometre of the diversion route/original route
AdjF(DR)/(OR) = TTC adjustment factor of the diversion route/original route
Dist(DR)/(OR) = Section length of the diversion route/original route
VOCDiv = Additional VOC per vehicle for diverting
TTC is multiplied by an additional factor to account for a potential difference in the value of travel time for different types of floods. This parameter should have a higher value for floods that are unanticipated. The perceived costs of diverting is the sum of the additional TTC per vehicle and the additional VOC per vehicle (PcostDiv = TTCDiv + VOCDiv). The perceived costs of diverting are used to determine when the option of waiting becomes more favourable than diverting. The point in time when waiting is more favourable to diverting has been denoted as the ‘equilibrium waiting time’, waiting before the equilibrium is reached is considered not feasible if we assume road users select the least cost option. The equilibrium waiting time is given in Equation 3.
Equation 3: Equilibrium Waiting Time

WTE = Equilibrium waiting time (hours)
PCostDiv = Perceived costs of diverting
Costperhr = Cost of one hour of waiting
MaxCostNT = Maximum perceived cost of not travelling
DC = Duration of closure
The equilibrium waiting cost is assumed to equal the perceived cost of diverting or if a diversion does not exist, the equilibrium waiting time is the minimum cost of not travelling or the duration of the road closure.
The maximum cost of not travelling10 has been used to determine a linear demand function for travel. The maximum cost of not travelling is the maximum value of the journey to the road user minus the cost of travelling along the original route. The percentage of road users not travelling when waiting is not feasible or when a diversion route does not exist (NT) is given in Equation 4.
Equation 4: Percentage not travelling11

The percentage of road users diverting when waiting is not feasible (D) or the percentage of road users waiting when a diversion route does not exist (W) equals to one minus (NT). The formulae for NT and D are expressed graphically in Figure 4.
Figure 4: Linear demand function used to determine number of road users not travelling
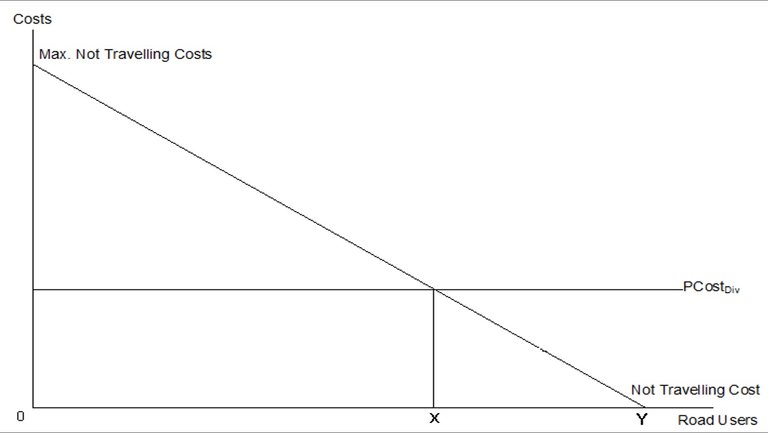
The percentage of road users opting to not travel when waiting is not feasible is XY/0Y and the percentage of road users opting to divert when waiting is not feasible is 0X/0Y.
The costs of diverting are calculated as the sum of perceived costs, accident costs and externalities; the formula is given in Equation 5.
Equation 5: Total diverting costs (TDC)

Accident costs are derived based on crash costs per model road state defined in the Transport and Main Roads cost benefit analysis model, which are derived from Austroads paper AP-R184. Externality costs are calculated based on vehicle kilometres travelled with 2007 unit values provided by Austroads paper IR-R156/08, which are updated using the consumer price index (CPI) provide by the Australian Bureau of Statistics (ABS).
The average costs of waiting per road closure are half the perceived costs of diverting if we assume the traffic volume is evenly distributed across the duration of the road closure. For road users who either not travel or wait when diverting is not feasible, the costs of waiting are calculated as an eighth the perceived costs of diverting. An eighth is derived by halving the costs of not travelling and the costs of waiting when diverting is not feasible, which is half the costs of waiting when diverting is feasible, which is half of the perceived costs of diverting. The costs of waiting are given in Equation 6.
Equation 6: Total waiting costs

The costs of not travelling are derived from the perceived costs of diverting and the percentage of vehicles not travelling; the formula is given in Equation 7.
Equation 7: Total not travelling costs (NTC)

The average costs of not travelling per road closure are half the perceived costs of diverting if we assume the demand for travel to locations that require the use of the closed route is linear. For road users who either not travel or wait when diverting is not feasible, the costs of not travelling are calculated as an eighth of the perceived costs of diverting13 . In Appendix A, the formulae are expressed and explained in three-dimensional graphs. The road closure costs are calculated annually by multiplying the diverting, waiting and not travelling costs by the annual exceedance probability (AEP)14 .
Costs of repairing roads damaged by floods (NDRRA) are allocated to the relevant sections of roads damaged by flooding. Both a base case and a project case estimate should be established. These costs should be lower in the project case than the base case and should be considered as maintenance benefits of improved flood immunity. Flood related accident costs have been calculated for major floods by multiplying the average number of flood related fatalities described in Section 2.4 by the Austroads unit cost per fatality (Austroads 2008)15 . The removal of mass restrictions on upgraded roads could provide additional benefits during the flood period as well as improved access all year round. The benefits of the removal of mass limits during the flood period can be assessed in the flood model but benefits for the rest of year should be calculated independently to this model.
3.3. An example of the application of methodologies discussed
To demonstrate the capturing of benefits using the currently practiced cost benefit analysis approach and the approach suggested in this paper, two hypothetical bridge projects have been assessed. They have been assessed using CBA6, partial endogenous road user behaviour CBA model and the proposed flood immunity model.
CBA6 is the Transport and Main Roads CBA tool, the partial endogenous road user behaviour (PERUB) CBA model is an excel based spreadsheet derived from the NIMPAC algorithms harmonized in Austroads paper AP-R264/05 with partially endogenously derived road user behaviour during road closures.
The approaches suggested in this paper have not been applied to an actual evaluation; therefore, a hypothetical case study of a plausible scenario has been derived. The flood immunity projects evaluated in this case study are two bridge upgrades in an area of low AADT with limited access during severe floods.
The collection of data of the types of floods that the region experiences are important as the nature of the floods could greatly influence the results of the evaluation. In the instance of this case study, data of the types of floods are assumed available. The full set of data applied to the evaluation is given in Appendix B.
In this example, TTC and VOC costs per vehicle have been extracted from TMR cost benefit analysis software (CBA6). The weighted average costs per vehicle for each section have been entered into the model using the formula given in Equation 8.
Equation 8: Weighted average cost (WAC) of TTC and VOC

This average is applied to the model and extrapolated over the life of the project based on projected growth rates and discount rates. Data is not always available for all the relevant factors; hence, assumptions should be made. To obtain a more accurate result, the number of assumptions should be kept to a minimum.
3.4. Results of Models
The results obtained from CBA6 and PERUB are quite similar. Both models consider an original route and a diversion route between C and B. In this model, all vehicles are able to divert to avoid the road closures. The mud map applied to these models is given in Figure 5.
Figure 5: Mud map of network considered in CBA6 and PERUB methodologies
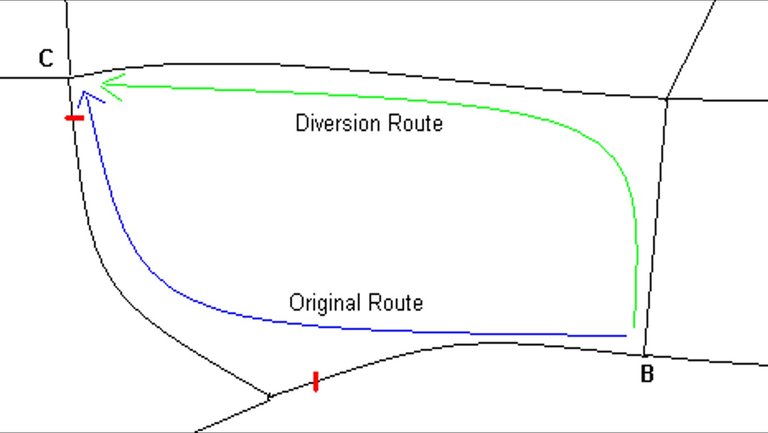
The proposed model is applied to a larger part of the network as shown in Figure 6.
Figure 6: Mud map applied to the example

Legend
Red Lines – Q2 Bridges/Culverts
Brown Lines – Q10 Bridges (mass limit 20 tonnes)
Blue Lines – Q20 Bridges
Green Lines – Q50 Bridges
Final and intermediate destinations of vehicles are required as inputs to this model. CBA6 and PERUB only require the AADT of each section of road. The results of the three models are presented in Table 3 and input data is provided in Appendix B.
Table 3: Results generated by models
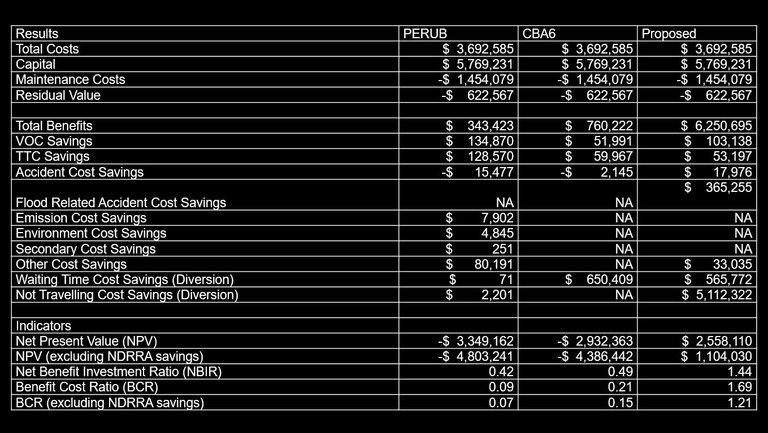
The benefits derived from the proposed model are considerably higher than both those obtained from CBA6 and PERUB. The main source of this difference is that the costs of not travelling are not fully identified by the other two models.
Town D losses access to all five other neighbouring towns when any form of flooding occurs. The impacts of lack of access to Town D are ignored by CBA6 and PERUB, which are focused on road users travelling the entire route between CB. CDB also acts as a heavy vehicle diversion route for heavy vehicle road users travelling between CF during periods of no flooding. When CDB is flooded, CAEF is the only viable diversion route for the heavy vehicles; this route is an additional 55km. If the two bridges along CDB are sufficiently upgraded, CDB can act as a diversion route for road users utilizing other parts of the network, which are only affected during major floods. During minor and moderate floods, five trips are no longer possible forcing road users not to travel. During a major flood, nine trips are no longer possible. After the two bridges are upgraded, all trips become available to all vehicle types as CDB becomes a possible diversion route for other flood-affected areas.
The projected reduced NDRRA costs, which can be included in either of the above three models, adds an additional $1.45 million worth of benefits to the projects. This value substantially improves the NPV of all three models. In this example, a clear discernable value of projected NDRRA costs has been allocated to the project site. In reality, collection and allocation of such costs can be difficult; estimates of these costs need to be made using historical data from the region.
The proposed flooding model can be used to assess the impact of upgrading different combinations of bridges to achieve the optimal bridge upgrade program for particular areas. Upgrading of the bridges along section CD and DB have been evaluated separately and compared with the option of upgrading both bridges; see Table 4 for the comparisons.
Table 4: Options analysis
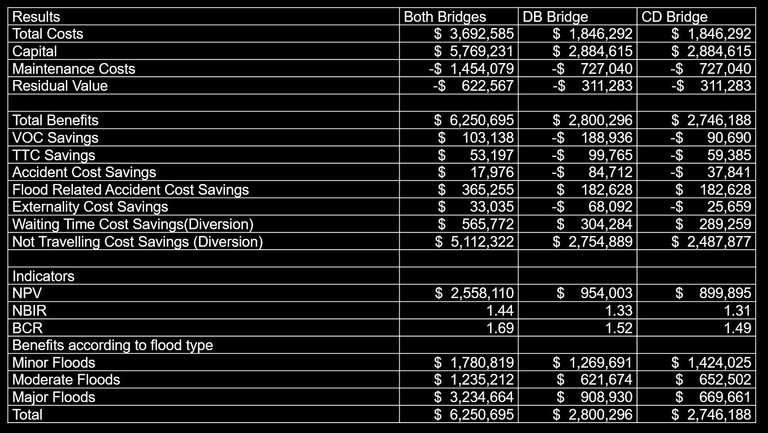
Upgrading of only one bridge greatly improves access during minor and moderate floods but does not provide many benefits during major floods; this is especially the case for the upgrading of the bridge along section CD. During heavy floods, Towns C and D become isolated from the other towns. If the bridge along Section DB is the only bridge upgraded, Town C becomes completely isolated from the network. Both bridges need to be upgraded for complete access to the regional network. The NPV of upgrading both bridges is greater than the sum of NPVs from both the CD and DB bridge upgrades. Upgrading of only one bridge also produces negative TTC, VOC, accident and externality benefits, these negative benefits occur because the upgrading of only one bridge provides improved access to towns C and D through long diversion routes rather than the original routes.
The proposed model has a number of limitations; the largest of these is the availability of data to feed into the model. Currently, traffic volumes are available per section of road but not per route. This data can be made available through transport studies but these studies are often costly to conduct. The quantity of data required for the proposed model is quite substantial compared to current models such as CBA6. The collection of this data could be time consuming and the results of the analysis will take longer to obtain. The proposed model does not generate values for travel time or vehicle operating costs per km of travel, these values need to be calculated prior to using the proposed model.
4. Conclusion
The costs to the road network and the costs to society from flooding can be enormous. The solution of improving flood immunity can greatly reduce these costs if the right projects are introduced at the right places. The current practiced methodology does not sufficiently account for the possible benefits obtainable from a large number of flood immunity projects. The model proposed in this paper addresses some of the issues surrounding the evaluation of benefits of flood immunity projects. These issues include identifying the impact a project has on the immediate network, identifying the impact of flood severity, valuing flood related accident costs, incorporating NDRRA flooding costs, valuing unanticipated flood costs, valuing costs of not travelling and the determination of endogenous road user behaviour. As seen from the results presented in Section 3.4, addressing the issues mentioned greatly increases the quantifiable benefits of flood immunity projects that relieve isolation to communities during flood events. Incorporating generated traffic and wider economic benefits would further enhance the assessment of benefits of some flood immunity projects and would be an appropriate next step forward from this paper.
Appendix A
Figure 7: Diversion costs
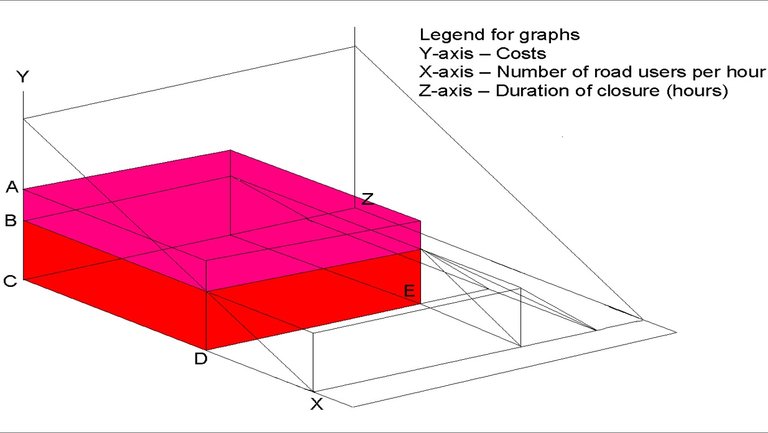
Figure 8: Waiting costs for road users who choose to travel
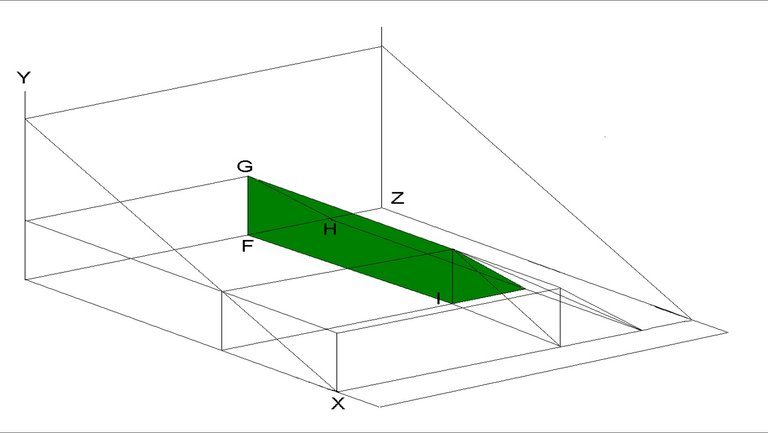
Figure 9: Not travelling costs when waiting is not a feasible option
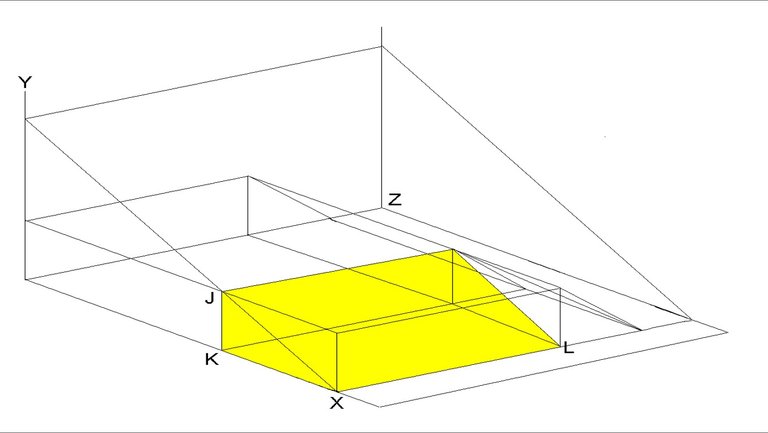
Figure 10: Waiting and not travelling costs when diverting is not a feasible option
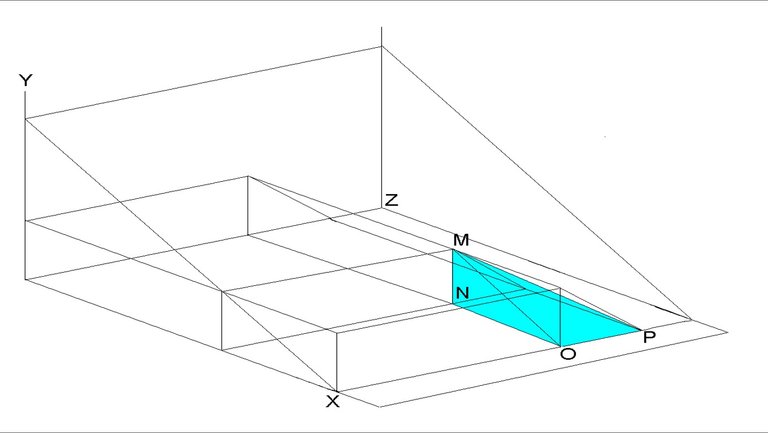
Mathematical Derivations of Formulae using Figures 7 to 10
Formula: total diverting costs (TDC)

Calculated using Figure 8

(Figure 7)
Where:
BC = perceived costs
AB = accident and externality costs
CD = duration of closure – equilibrium waiting time
DE = number of road users diverting per hour
Formula: total waiting costs

Calculated using Figure 8 and Figure 10

(Figure 8 + Figure 10)
Where:
GF = perceived costs
FH = equilibrium waiting time
FI = number of road users diverting per hour
MN = perceived costs
NO = equilibrium waiting time
OP = number of road users not travelling per hour
Formula: total not travelling costs (NTC)

Calculated using Figure 9 and Figure 10

(Figure 9 + Figure 10)
Where:
JK = perceived costs
XL = duration of closure - equilibrium waiting time
KX = number of road users not travelling per hour
MN = perceived costs
NO = equilibrium waiting time
OP = number of road users not travelling per hour
Formula: Flood related accident costs (FRAC)

Appendix B
Input data according to section

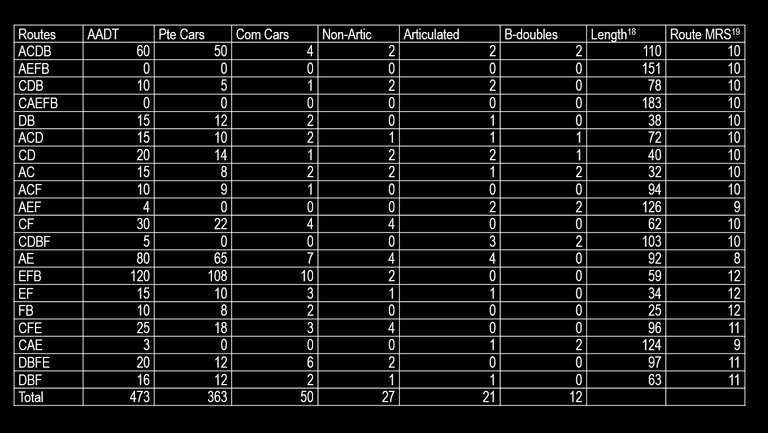
Input data according to route
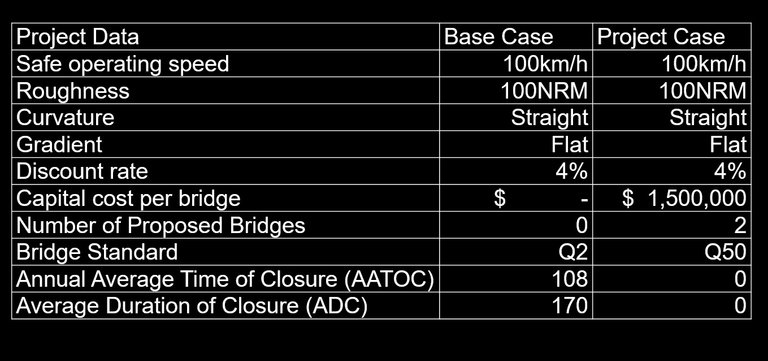
Project data
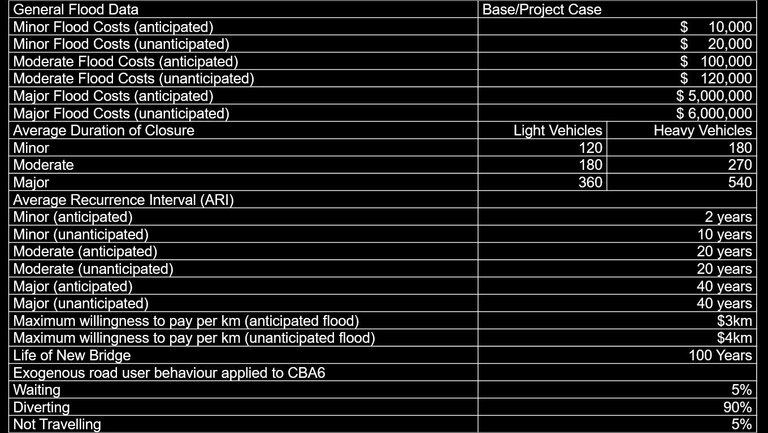
Flood data
End Notes
- The Bruce Highway is a major highway linking Brisbane to Northern Queensland, the Bruce Highway has a length of over 1600km (Wikipedia 2011).
- Ranking
- These values are current as of 17 November 2010 according to RIP Live databases, these figures may vary from those published in the Queensland Transport and Roads Investment Program (QTRIP).
- Costs in this case refer to the road user’s perceived costs, which includes travel time costs.
- Flexibility of travel options refers to the road user’s flexibility in travelling at different times or to different locations.
- The cost of not making the journey is the difference between the value of the journey to the road user and the cost of the journey to the road user when the road is not closed.
- This conclusion was derived from reading a sample of BCA reports conducted in recent years.
- A Q50 bridge is built to a standard where it will only flood during a Queensland 50-year or worse flood event.
- This is the value of the destination to the road user; this value can vary quite considerably depending on the nature of the journey.
- Maximum cost of not travelling can be adjusted according to the duration of the road closure depending on whether the opportunity cost of the alternative activity is sensitive to time.
- This equation holds true, as the demand function is assumed linear.
- If a diversion route does not exist, PCostDiv should be replaced with Min(MaxCostNT, DC×Costperhr), this same assumption is applied to Equation 6.
- The cost of waiting and the costs of not travelling are assumed equal for the period when diverting is not feasible.
- AEP is the probability that flooding will occur, this probability is calculated with the formula AEP=1-exp(-1/ARI) , ARI is the average recurrence interval of flooding (Bureau of Meteorology 2010)
- Formula applied to the model is given Appendix A
- Non-Articulated Vehicles
- Model Road State (MRS)
- Route length is the sum of section lengths comprised in the route
- Route MRS is the weighted average of MRS of the sections comprised in the route
References
ABC Far North Queensland (2011), Flood threat eases on Qld’s Tablelands, available at: http://www.abc.net.au/news/stories accessed on 04/04/2011
Ashley, S. T. and Ashley, W. S. (2008), Flood fatalities in the United States, Journal of Applied Meteorology and Climatology, 47, 805-818
Attorney-General’s Department (2009), Australian Emergency Management Terms Thesaurus, Australian Government, available at http://library.ema.gov.au accessed on 30/05/10
Australian Bureau of Statistics (2007a), Maryborough (Urban Centre/Locality), 2006 Census QuickStats, available at http://www.censusdata.abs.gov.au, accessed on 04/04/2011
Australian Bureau of Statistics (2007b), Charleville (Urban Centre/Locality), 2006 Census QuickStats, available at http://www.censusdata.abs.gov.au, accessed on 04/04/2011
Australian Bureau of Statistics (2010), National Regional Profile: Gympie (R) (Local Government Area), available at http://www.abs.gov.au/AUSSTATS/, accessed on 04/04/2011
Australian Bureau of Statistics (2010), 6401.0 – Consumer Price Index, Australia, Jun 2010
Australian Transport Council (2006): National Guidelines for Transport Systems Management in Australia, 4 Appraisal of initiatives, Commonwealth of Australia, Canberra
Austroads (2001), Economic Evaluation of Road Investment Proposals: Improved Predictions Model for Road Crash Savings, Austroads, AP-R184
Austroads (2005), Economic Evaluation of Road Investment Proposals: Harmonisation of Non-Urban Road User Cost Models, Austroads, AP-R264/05
Austroads (2008), Austroads Internal Report: update of RUC Unit Values to June 2007, Austroads, IR-156/08IR-156
Bureau of Meteorology (2010), ARI and AEP, Australian Government, available at http://www.bom.gov.au/hydro/has/ari_aep.shtml accessed on 21/04/10
Bureau of Meteorology (2011), Queensland Flood Summary 2000 onwards, Australian Government, available at http://www.bom.gov.au/hydro/flood/qld/fld_history/floodsum_2000 accessed on 30/03/11
Cernaianu, N. (2010), Risk Management in Road Transport, Munich Personal RePEc Archive, Paper No. 27047, University of Bucharest, Romania
Coates, L. (1999), Flood fatalities in Australia, 1788-1996. Aust. Geogr., 30, 391-408
Department for Transport (2006), Transport, wider economic benefits and impacts on GDP, Department for Transport, London
Department of Transport and Main Roads, (2010a), TMR Infrastructure Program Performance Report, Queensland Government
Department of Transport and Main Roads, (2010b), Roads Implementation Program Development 2009-10 to 2013-14, Queensland Government
Department of Transport and Main Roads (2010c), Roads Implementation Program Development 2009-10 to 2013-14 Live, Queensland Government, accessed 17 November 2010
Department of Transport and Main Roads (2010d), Flooding on roads in Queensland, Queensland Government
Department of Transport and Main Roads, (2011a), Flooding Locations, Flood Closures and Flood Immunity Standards for the Bruce Highway (Brisbane to Cairns) (Presentation), Queensland Government (not published)
Department of Transport and Main Roads, (2011b), Cost benefit analysis manual, Queensland Government, Brisbane
Earth Science Australia (2010), Flood Damage Assessment Case Study – Johnstone River Flooding, Earth Science Australia, available at http://earthsci.org/flood/j_flood04/flood/ accessed on 21/04/10
Geoscience Australia, (2010), Flood Information, Australian Government, available at http://www.ga.gov.au/hazards/flood/ accessed on 21/04/10
Jonkman, N. J. and Kelman, I. (2005), An analysis of the causes and circumstances of flood disaster deaths, Blackwell Publishing, 75-97
Wikipedia (2011), Bruce Highway, available at http://en.wikipedia.org/wiki/Bruce_Highway accessed on 04/03/11
Discord Server.This post has been manually curated by @steemflow from Indiaunited community. Join us on our
Do you know that you can earn a passive income by delegating to @indiaunited. We share more than 100 % of the curation rewards with the delegators in the form of IUC tokens. HP delegators and IUC token holders also get upto 20% additional vote weight.
Here are some handy links for delegations: 100HP, 250HP, 500HP, 1000HP.
100% of the rewards from this comment goes to the curator for their manual curation efforts. Please encourage the curator @steemflow by upvoting this comment and support the community by voting the posts made by @indiaunited.
@tipu curate
Upvoted 👌 (Mana: 43/63) Liquid rewards.