Hi Everyone,

Welcome to the fourth post in my conference and journal paper post series. This series will contain ten conference and journal papers from my time working in the Queensland Government. In my post, My Peer Reviewed Conference and Journal Papers, I explain the purpose of this series.
Dealing with Projected Capacity Constraints in Road Project Appraisals was the only paper I have worked on with someone else. I wrote the first half of the paper, and my colleague Mark Best wrote the second half of the paper. I focused on the theory, and he discussed the application of the theory to a cost benefit analysis he had conducted recently for a road bypassing Townsville (a town in North Queensland).
This paper was significant as it analysed the impact of different traffic volumes in the base case and project case. In the base case, traffic volume is constrained by lack of capacity. This may occur very early in the evaluation period. In the project case, traffic volume is constrained much later or not at all. This leads to a problem when comparing the costs of both groups of vehicles. This problem is most pronounced for bypass projects, hence the selection of the case study.
This paper was to be presented at the Australasian Transport Research Forum (ATRF). That year, it was held in Brisbane. Therefore, the cost of sending us was considerably less than if we had to fly to another city. Transport and Main Roads had no issue with sending us to this conference or with the content to be presented. The same could not be said about my other paper and presentation. I discuss this in my next post.
Dealing with Projected Capacity Constraints in Road Project Appraisals
Abstract
Saturation of road infrastructure has considerable impact on vehicle operating speeds and traffic volumes. Projects can be designed to increase the capacity of the road or network so that operating speeds are maintained. Information is often limited regarding future traffic behaviour in the base case; this is especially true if the road is expected to reach capacity before the end of the applied evaluation period. If a road is projected to reach capacity in the base case and not the project case there will be a disparity in traffic volumes between the cases. This disparity can present a number of problems for the analyst.
This paper focuses on the evaluation of town bypass projects. Town bypasses increase the capacity of the network by allowing through traffic to avoid urban areas. These urban areas often have insufficient capacity to cater for projected traffic volumes. In the context of town bypasses, this paper aims to identify the problems in determining benefits when such capacity issues arise and identify the approaches that can be applied to remedy these problems.
An applied case study is used to illustrate the practical effects of applying differing theoretical approaches. Alternate scenarios illustrate evaluation results using various suggested theoretical approaches. The rationale behind the application of these alternate approaches is explored and discussed with the goal of matching theory with enhanced analytical rigour and accuracy. Ultimately, this paper discusses economically rigorous approaches and reports results from the application of different approaches in dealing with excessive traffic volumes.
1. Introduction
Saturation of infrastructure is a common problem for towns and cities along busy freight routes such as the Bruce Highway, Queensland. Numerous population centres including Gympie, Innisfail, Townsville, Mackay, Rockhampton, Home Hill and Ayr, and Childers all have proposed bypasses intended to reduce congestion and move heavy vehicles out of town centres (Transport and Main Roads, 2013).
Once a road reaches saturation, traffic volumes are unable to increase, with this problem eventually occurring in the base case1 of most bypass evaluations. The project case2 of these evaluations have additional capacity; therefore, traffic volumes are most likely to increase across the life of the project eventually exceeding the projected base case traffic volumes (Goodwin, Hass-Klau and Cairns, 1998). This difference in traffic volumes between the base and project cases is the source of potential problematic issues. Where does the traffic go in the base case? How can the costs for these road users be accounted for? How to compare the road user costs of different traffic volumes in an economic analysis? Currently, there is limited literature available to provide insight into addressing these questions in the context of bypass projects.
There are numerous engineering solutions that can provide additional capacity to a road network. In discussing factors affecting capacity, Yagar (1991), notes several factors affecting the capacity and service level of two-lane roads. Although noting the difficulty in quantifying exact effects, opposing volume and traffic interferences, as well as traffic composition are observed as having major impacts upon capacity. Bypasses allow large volumes of traffic the option of avoiding potentially congested urban areas, improving traffic flow to both local and through traffic. The reduction in traffic volume along the urban network also reduces the effects of noise pollution and other traffic externalities (Austroads, 2012). The addition of the bypass may have a delaying effect upon the requirement for sub-section intersection upgrades3 .
Investing in projects that increase capacity for any given traffic volume will yield benefits in terms of travel time cost, vehicle operating costs and accident cost savings (Bureau of Transport and Communications Economics, 1997). Specifically in reference to town bypasses, traffic passing through a town experiences delays, while generating congestion for local traffic within the town. Construction of a town bypass therefore benefits both through traffic and local traffic (Bureau of Transport and Communications Economics, 1997).
This paper investigates several approaches to resolve problems of excess volume capacity ratio (VCR) and presents a recently evaluated bypass project case study. The approaches discussed in this paper centre around incomplete information regarding future treatments of the base case and movements of traffic that cannot use the evaluated existing sections of road in the base case. An approach to evaluate the project given close to complete information is initially discussed. This approach is used as a yardstick in comparing other approaches. The case study discussed in this paper was evaluated using cost benefit analysis (CBA). The proposed analytical approaches are applied to this case study and resulting benefits streams compared. Each of the approaches discussed have limitations, with the case study illustrating the effects of such limitations.
2. Defining the Problem
A major upgrade of a road or construction of a new road such as a bypass can result in traffic volume increasing beyond the capacity of the original road/s (Goodwin, 1996). The upgraded section or new road with the larger capacity can accommodate increased traffic volume. Such differences in capacity present predicaments when evaluating such projects as traffic volumes will differ between the base and project cases. For a road upgrade, road user cost (RUC) savings are calculated by subtracting the project case RUC from the base case RUC (Transport and Main Roads, 2011), see Equation 1.
Equation 1
RUC Savings = 365.25 × ∑(RUCBCVT × AADTBCVT - RUCPCVT × AADTPCVT
Where:
RUCBCVT = Road user costs per vehicle type in the base case
RUCPCVT = Road user costs per vehicle type in the project case
AADTBCVT = Annual Average Daily Traffic4 per vehicle in the base case
AADTPCVT = Annual Average Daily Traffic per vehicle in the project case
If the traffic volume is higher in the project case than the base case, the calculation of RUC savings will be distorted as the project case RUCs are multiplied by a higher value. For example, if an upgrade reduces RUC by half but the number of vehicles in the project case double, RUC savings will be erroneously calculated as zero.
For a new road such as a bypass, the total RUC is calculated by summating the RUC for the existing road sections and the bypass section using the formula given in Equation 1. The total traffic volume for the existing sections in the base case must equal the total traffic volume of the new bypass multiplied by number of existing sections bypassed plus the total traffic volume for the existing sections in the project case, see Equation 2.
Equation 2
TVTotal = n × TVBypass + TVE1 + TVE1 +… + TVEn
Where:
TV = traffic volume
n = number of existing sections of road
E1…n = existing sections of road to be bypassed
We assume vehicles using the bypass originally passed through all existing sections of road; therefore, these vehicles are included in the traffic counts of these sections.
For new roads and bypasses, total traffic volumes of the base and project case rarely tally (Frohlich, 2003). This is normally because road users from other parts of the network or new road users move5 onto both the bypass and the existing route as the cost savings obtained from the increase in capacity attract them (Goodwin 1996). Accounting for these additional road users is especially difficult when resources do not permit for an analysis of the entire relevant network.
The most commonly prescribed approach in Transport and Main Roads (TMR) is to cap AADT when the volume capacity ratio (VCR) is equal to 1.256 . The problem of taking this approach is that any increases in RUC per vehicle from the additional traffic in the project case are not recognised. Benefits to induced traffic and traffic diverting from other infrastructure are not quantified. Likely improvements in the base case are also not currently considered.
3. Approaches
Perfect information regarding the base and project case scenarios is almost never available. A common method of dealing with imperfect information is to apply sensitivity analysis to a CBA. Sensitivity analysis is recommended in most CBA textbooks and national guidelines as a method of dealing with uncertain information7 . Unfortunately, sensitivity analysis does not adequately address the range of possibilities that could occur when traffic volume is expected to exceed capacity. This paper investigates different approaches that can be applied in some capacity projects subject to the availability of information. The requirements, benefits and potential inaccuracies of using each proposed approach are discussed in Sections 3.1 to 3.7. These approaches are derived from both analytical experience in TMR and theory adapted from Austroads and the Australian Transport Council (ATC) guidelines. Basic illustrative data has been used to explain some of the more complex elements of the approaches discussed. Key approaches including capping traffic growth below a VCR of 1.25 in both base and project cases, reducing the evaluation period and incorporating mandatory upgrades to the base case once capacity is reached.
3.1. Perfect information – a straightforward theoretical illustration
The perfect information approach is the most complete approach8 subject to the usually unrealistic assumption all relevant information is available and minimal assumptions are required. The information assumed available in particular is:
- All sections of road that have traffic volumes influenced by the proposed upgrade are known.
- The impact of the upgrade on the traffic volumes of all sections of road can be quantified.
- The elasticity of demand for travel for all vehicle types anywhere along the relevant network is known.
- The number of induced trips that will occur during each year of the evaluation period can be accurately forecast.
- The timing and costs of any alternative upgrade to be made in the base case is known.
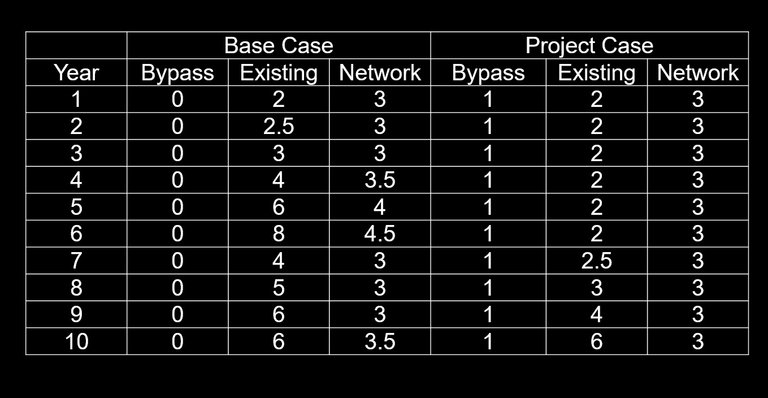
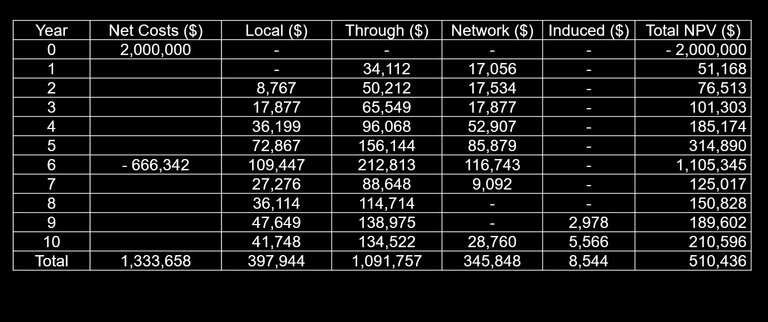
An implication of the above discussion is that of perfect traffic modelling, including demand forecast prediction. Given the above information, an approach can be devised to reasonably capture the costs and benefits of a project. Using Tables 1 and 2 as basic data for a bypass project and assuming capital costs for the upgrade is $2,000,000 in year 0 and the costs of alternative action in the base case is $1,000,000 in year 6, an approach with complete relevant information can be demonstrated.
Table 1: AADT9 in illustrative example
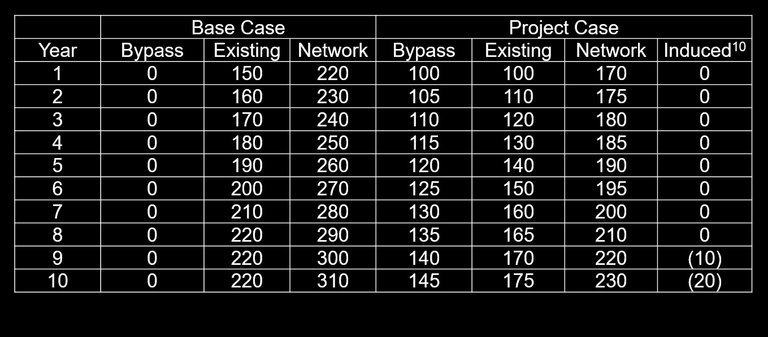
Table 2: Road Users Costs per vehicle for each year of the evaluation
AADT is capped in the project case once new trips are generated (induced traffic) on the network as a result of the proposed upgrade; in Table 1, this occurs in Year 8. The formula for induced traffic presented in this paper is consistent with the definition of induced traffic provided by Lee, Klein and Camus (1999), relating to additional trips on the network induced by the improvements to the project case11 . The formula applied to calculate induced traffic volume is given in Equation 3.
Equation 3
Induced Traffic = AADTBypass + AADTEx(PC) + AADTNet(PC) - AADTEx(BC) - AADTNet(BC)
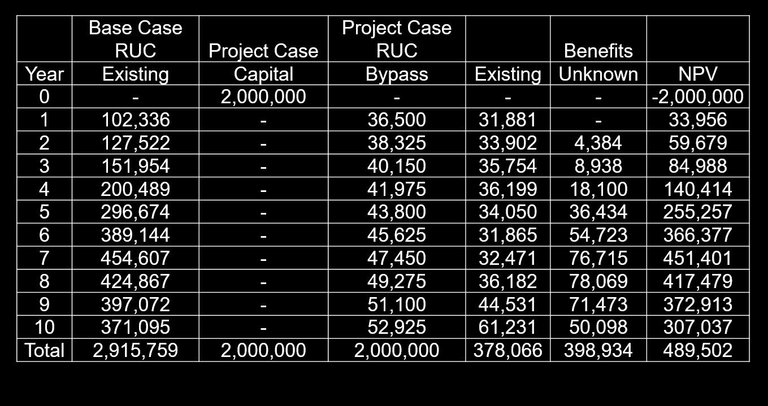
Where: With the information given in Tables 1 and 2, RUC savings can be calculated for local traffic, through traffic, induced traffic and traffic in other affected parts of the network. Table 3 contains the breakdown of AADT according to purpose of the trip made by the road user. The formulae used to determine the AADT of existing local, through, diverting and network traffic are given in Equations 4, 5, 6 and 7. Equation 4 Existing Local = AADTExisting(BC) – AADTBypass(PC) Equation 5 Through Traffic = AADTBypass(PC) Equation 6 Diverting Traffic = AADTNetwork(BC) – AADTNetwork(PC) Equation 7 Network Traffic = AADTNetwork(PC) Table 4 contains hypothesized savings per road user according to the purpose of the trip. The formulae used to determine the RUC savings per vehicle for existing local, through, diverting and network traffic are given in Equations 8, 9, 10 and 11. Equation 8 Existing Local (RUCsavings) = RUCExisting(BC) - RUCExisting(PC) Equation 9 Through Traffic (RUCsavings) = RUCExisting(BC) - RUCBypass(PC) Equation 10 Diverting Traffic (RUCsavings) = RUCNetwork(BC) - RUCExisting(PC) Equation 11 Network Traffic (RUCsavings) = RUCNetwork(BC) - RUCNetwork(PC) Using the RUC savings in Table 4, the AADT in Table 2 and the capital costs of $2,000,000 in year 0 of the project case and capital costs of $1,000,000 in year 6 of the base case, discounted savings and costs can be calculated, as shown in Table 5. This approach, although theoretically sound, usually proves unrealistic, as sufficient data in terms of quality and clarity, is rarely available. Such an approach provides context to discussions around further approaches and serves as a benchmark for further discussion. Elaborations around traffic demand and appropriate modelling technique, calculation of traffic demand elasticity, fleet growth projections, along with the methods of calculation are outside the scope of this paper. Economic evaluation is driven by the analysis of data estimated with a high degree of accuracy, allowing models to mimic reality. In cases where less than complete information is apparent, further approaches need to be explored and these are discussed in Sections 3.2 to 3.5. An unconstrained traffic growth approach assumes traffic grows unconstrained in all cases, with no consideration around the effect of sustained traffic growth on VCR. Such an approach ensures AADT remains the same in both the base and project cases; therefore, results are not distorted because additional RUCs from additional vehicles are not included in the project case. Additional information regarding diverting traffic or induced traffic is not required, as this traffic is not considered to occur. Additional upgrades in the base case would still ideally be required but the assumed continued growth makes this less of a necessity. This approach is also simple and requires minimal additional modelling16 . The biggest problem with this approach is that base case RUCs are likely to be greatly distorted, as large traffic volumes that cannot reasonably be expected to travel in the base case will incur the RUC of travelling in heavy congestion. Project case RUCs will not suffer the same distortion as traffic volumes will generally be able to increase due to the extra capacity and will not incur the RUC of a congested road. The results of the evaluation will likely be distorted in favour of the project case due to these high base case RUCs. The additional capital approach provides assumptions around incremental capital expenditure in the base case once the capacity of the road has been reached, thus ensuring the base case remains realistic in terms of VCR. Manipulation of future traffic volumes is not required, with VCR never becoming a problem, as additional capacity is repeatedly factored into the analysis over time. The biggest problem with this approach is specification of the additional capital cost, the scope of the upgrade in the base case, the timing of the upgrade and its effect on VCR. Cost estimates are rarely available for future capital expenditure likely to occur in the base case. The extent of the capacity improvement is also unlikely to be known and may need to be assumed proportionate to the likely capital expenditure. The timing of the upgrade (though assumed to occur when the VCR is between 1 and 1.25) could vary by a number of years. The base case of the alternative option would still have the problem of traffic volumes growing unrealistically beyond capacity. If the proposed upgrade in the base case improves the capacity similar to that of the project case, the majority of the benefits to the project will be in the years prior to the assumed base case upgrade. Ultimately, when the specification of capital is arbitrary, and its effects and consequences cannot be quantified, application of this approach has very limited effectiveness. The shortened evaluation period approach simplifies the additional capital approach by reducing the evaluation period to the year just prior to the year VCR exceeds 1.25 in the base case. This approach does not require any assumptions around additional capital expenditure or capping of traffic volumes, but will require assumptions around asset residual values. For example, if the life of the asset is 30 years and VCR reaches 1.25 in year 10 of the base case of the evaluation, a residual value should be calculated based on the remaining 20 year life of asset. However, reducing the evaluation period to when the base case reaches capacity is likely to underestimate project benefits. This underestimation could be quite considerable if the evaluation period is reduced greatly by this assumption, as shortening leads to a decrease in benefit streams. With accurate traffic demand allowing for accurate estimation of the year in which VCR exceeds capacity, the shortened evaluation period approach enables the analyst to assess the economic effectiveness of the proposed engineering solution without dealing with the uncertainty of future traffic movements once capacity is reached. This approach could be seen as an incomplete analysis to avoid making claims about future traffic movements. The biggest question mark about this approach is whether the years evaluated are sufficient for any meaningful conclusions to be drawn from the evaluation. Another variation of the shortened evaluation period approach would be to reduce the evaluation period to when the project case reaches capacity if the capacity is reached before the end of the evaluation period. This variation of the approach does not solve the problem of the treatment of base case traffic volumes that exceed the capacity of the road in the base case. This variation could be combined with the unconstrained traffic growth approach or the limiting traffic growth to VCR approach to be discussed in Section 3.5. The limiting traffic growth to VCR approach involves capping traffic growth for the proposed bypass and the existing sections of road. This approach was applied to the evaluation of the case study project and was deemed an appropriate treatment in addressing the capacity constrained existing section of road. This approach17 is the second most complex of the five approaches discussed in this paper but should achieve results closest to those stated in the perfect information approach given limited information. To demonstrate this approach the traffic volumes for the existing section of road and unit values applied to the perfect information approach are used. Data regarding the network is assumed unknown. Traffic counts are provided in Table 6. The total number of vehicles in the base and project cases does not match. To resolve this problem, the number of vehicles to be considered in the project case existing section is derived by calculating the difference between the projected traffic volume to use the bypass and the existing traffic volume in the base case. The difference in actual traffic using the existing section in the project case and the calculated value is temporarily removed from the analysis. The relationship between the base case and the project case traffic volumes is expressed in Equations 12 and 13. Equation 12 Calculated Existing TrafficPC = Actual Existing TrafficBC - Bypass TrafficPC
Equation 13 Unaccounted for TrafficPC = Actual Existing TrafficPC - Calculated Existing TrafficPC
Once traffic growth has ceased in the base case, the total traffic growth is ceased in the project case. The growth in traffic has been allowed to continue on the bypass but put in reverse on the existing section. This assumption has been made as the demand for travel for road users bypassing the town are more inelastic than demand for local trips where alternative routes may exist or trips can be more easily delayed (Graham and Glaister, 2011). For the total traffic volume to remain constant, while allowing the traffic volume to increase on the bypass, the traffic volume on the existing road needs to fall, by the increase in traffic volume on the bypass. Road user costs calculated for each vehicle are based on actual vehicles numbers using the existing section in the project and not a figure derived for the calculated number. This has been done as all traffic on the existing road contributes to the unit costs. The road user costs applied per vehicle are given in Table 7. These figures closely resemble those used to demonstrate the perfect information approach with the exception of increased base case costs per vehicle in years 7 to 10 based on the assumption there is no base case upgrade. The results of the CBA include benefits to road users that were not travelling on the evaluated portion of the network in the base case. These benefits were calculated by dividing the savings per road user using the existing road in the project case by half and multiplying by the number of unaccounted road users, as in Equation 14. Equation 14 Benefits Unaccounted RoadUsers = ½ × Savings Local × Unaccounted RoadUsers × 365.25
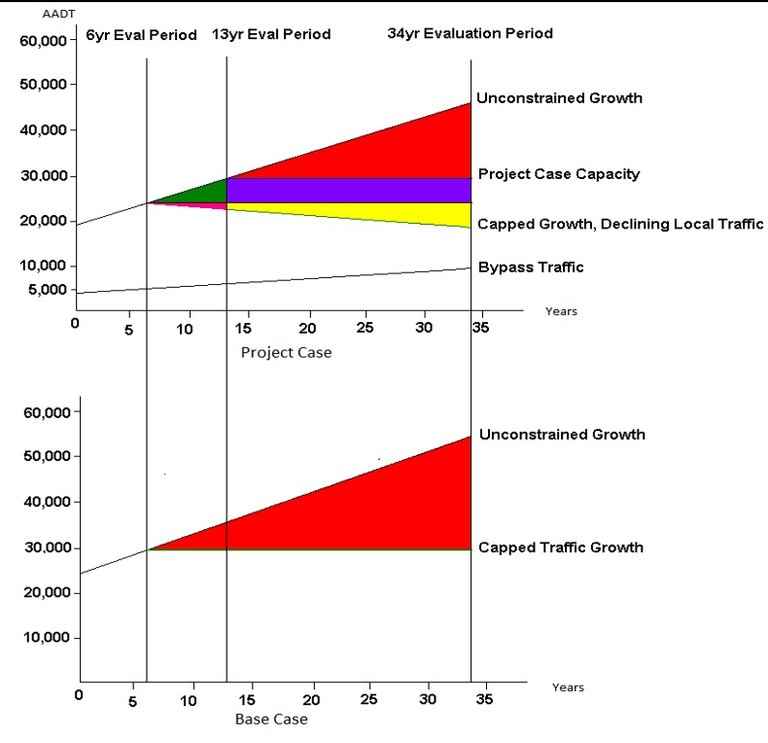
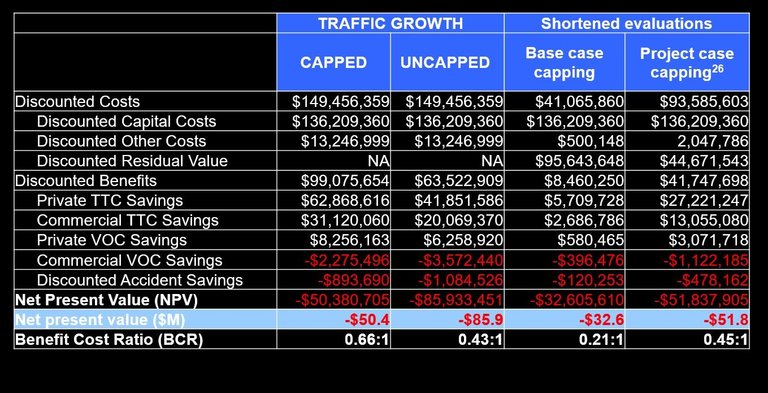
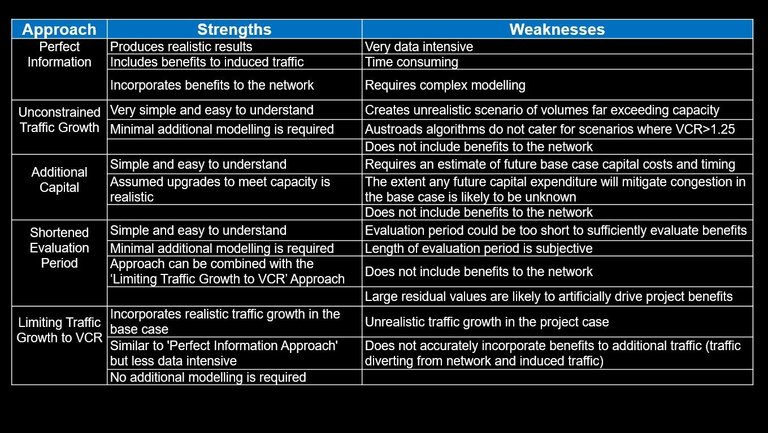
Savings for road users using the existing road in the project case have been selected as the road users using the bypass have already been accounted for in the evaluation22 . Table 8 contains the results of the CBA. The net present value (NPV) using the limiting traffic growth to VCR approach is likely to be lower than the NPV using the perfect information approach, as benefits to the local network are not fully incorporated. Of the five approaches discussed, three were applied to the case study. Those three approaches are unconstrained traffic growth, the shortened evaluation period and limiting traffic growth to VCR approaches. Additionally, the shortened evaluation period has been applied where VCR equals 1.25 in the base case as well as in the project case. The perfect information and additional capital approaches could not be applied due to lack of sufficient data. The standard tool used by TMR (CBA6) was not designed to be perfectly compatible with the five approaches suggested in this paper, as it does not incorporate traffic diverting from other parts of the network or induced traffic for bypass evaluations. Figure 1 provides a graphical representation to compare the traffic volumes applied using each approach. Figure 1 represents the existing section (base case), the existing section (project case) and the bypass. Sections of the figure are marked according to evaluation period to illustrate respective cut-off points. The red areas in the figure represent unrealizable traffic volumes due to limited capacity. For the case study, this red area begins in year 6 of the base case and year 13 for the project case. The green and pink areas represent the additional traffic on the existing road in the project case before saturation is reached in the project case. The blue and yellow area represents the additional traffic on the existing road after the project case has reached saturation. The green and blue areas represent the additional traffic on the analysed portion of the network (bypass and existing sections). The pink and yellow areas represent the decrease of local traffic caused by crowding out by the through traffic. The demand of through traffic is assumed more inelastic than the demand of local traffic for the use of the road network (Graham and Glaister 2011), and local traffic is assumed able to use other parts of the local network, delay travel or not travel at all, whereas through traffic is more committed to the journey. In the case study, capacity restricts traffic growth on the existing road, therefore impeding local traffic flow rather than through traffic flow. The applied limiting traffic growth to VCR approach caps traffic volume in both base and project case in year 6 when traffic volume reaches the VCR of 1.25. The costs per vehicle from this year onwards are calculated in CBA6 using the capped traffic volume. This differs from the theory described in Section 3.5, which prescribes that the costs per vehicle should be calculated using the actual increases in traffic volume. The benefits to the additional traffic represented by the green area in Figure 1 were also not included in the applied approach. These departures from the theory will partially cancel each other out. In the case study, the lower costs from the exclusion of congestion from the project case are likely to cause an overestimation of benefits. The unconstrained traffic growth approach does not involve capping and does not vary from the approach described in Section 3.2. The applied shortened evaluation period approach (base case) does not apply any change to traffic volumes or growth but merely reduces the evaluation period to when the base case reaches a VCR equal to 1.25. The application of this approach does not vary from the theory described. The applied shortened evaluation period approach (project case) is very similar to the applied limiting traffic growth to VCR approach. The only difference in these two approaches is that the shortened evaluation period approach (project case) has an evaluation period reduced to just 13 years. This applied approach again excludes the benefits from the additional traffic represented by the green area as well as benefits to the growing proportion of through traffic represented by the pink and yellow areas of Figure 1. The inclusion of residual value for the asset will compensate for the benefits not included for the remaining 17 years of asset life. It is difficult to conclude if this value will sufficiently compensate or over compensate for those benefits. All of the approaches discussed in this paper that are not subject to perfect information are flawed in some way. The application of the approaches to an actual project is additionally flawed due to limitations in the data and analytical tools. In the absence of perfect data, the limiting traffic growth to VCR approach remains the preferred approach. After further investigation a variation of this approach, which also includes shortening the evaluation period to the year that the project case reaches capacity is likely to produce more realistic results. Appendix A contains a summary of the strengths and weaknesses of each proposed approach. To illustrate an application of the theoretic conceptual thinking, a case study in the form of a bypass was selected to demonstrate the application of the approaches discussed throughout Section 3. Applied approaches included changes in traffic growth, the capping of traffic growth to match a VCR of 1.25 and changes to the assessed project evaluation period. The base case includes vehicles running along a route located west of Townsville, which includes a section of the Bruce Highway. This route features a number of intersections, with inherent delays and expected accident rates. The project case consists of an approximately 10 kilometre stretch of two-lane roadway, bypassing numerous intersections for through traffic and includes construction of an on/off ramp at its southern end and newly signalised intersection treatment at its northern end. Traffic modelling indicated that a number of intersections are approaching saturation. Reductions in traffic volumes would be expected to reduce congestion at intersections, as traffic switches to the bypass. Expected benefits of a bypass include reduced local congestion; travel time cost savings as well as improved safety23. The TMR cost benefit analysis tool CBA6.124 , along with customised Microsoft Excel spreadsheets were used in deriving expected net project benefits. Results are shown in Table 9. In regards to a discussion of the generated results, while results are exclusive of expected savings for existing intersections from fuel, delays and accidents, as well as enhanced flood immunity from the project bypass, some comparative remarks can be made. Following the suggested approach of capping traffic growth rates in line with VCR offers the highest rate of generated project benefits. Project benefits, including private and commercial travel time savings, vehicle operating cost savings and accident savings are all relatively higher when compared with all other proposed treatments. Whilst not suggestive of any conclusive definable relationship, it must be noted that these benefits are roughly one third higher when compared directly to the uncapped case results. Another reason why these results may appear higher is due to the capping of traffic volumes in the project case before operating speeds drop due to congestion. The costs in the project case are therefore rendered artificially lower, as the costs of the additional traffic are not considered for the costs per vehicle. This would not present a problem if the proposed upgrade resolved congestion for its asset life (30 years). Application of the uncapped approach leads to a deterioration of results, as can be seen, with benefits reduced due to the compromising of vehicle speeds as congestion sets in, with vehicles forced to travel at queue speed, an indication of road saturation. This is due to traffic being permitted to grow at the expected growth rate, resulting in a VCR in excess of the recommended figure of 1.25. Further confirmation was obtained through reference to a detailed results report (not shown) demonstrating poor performance in terms of vehicle speed from very early on in the evaluation period. The results are contrary to those predicted in Section 3 due to the project case reaching capacity shortly after the base case, hence greatly reducing benefits from the remaining evaluation period. For the case of shortening the evaluation period to when the VCR equals 1.25 in the base case, the evaluation period was reduced to just 6 years, which included 4 years of construction. In the case study, this approach proves to be unsatisfactory as only 2 years of benefits are calculated and the remainder of benefits/cost savings are residual value. For the case of shortening the evaluation period to when the VCR equals 1.25 in the project case the evaluation period was reduced to just 13 years, which included 4 years of construction. Here, only 9 years of benefits are calculated, which is still only a small portion of the total evaluation period but 7 years more then the previous approach. From year 6 to year 13 total traffic volume was capped to zero growth as described in the first capped approach. The shortened evaluation period presents the closest scenario to reality given that the project case is projected to be saturated in year 13 and that CBA6 uses the costs per vehicle at the point the capping occurs, not reflective of the increasing costs beyond when the base case is saturated. Reducing the evaluation period to when the existing section reaches capacity in the project does not recognize the benefits to additional vehicles using the bypass, which is not projected to reach capacity until after the 30 years of asset life. Necessarily, in both cases, the residual value has been calculated using a straight line depreciation method at the end of which traffic growth is capped and simply returned to the project as a cost saving. Both treatments produce very low benefits due to the short length of the benefit stream compared to the case when a 30-year benefit stream has been used. Due to their short evaluation periods both of these cases return high amounts in the form of savings through residual amounts. Solutions to this problem include duplicating the bypass, upgrading the existing sections of road or improving the connectivity of the bypass to existing sections of road27 . Duplicating the bypass increases the capacity of the bypass but the problem for TRRIV is congestion along existing sections. If existing sections of road can be upgraded, congestion can be relieved. If these sections cannot be upgraded then the connectivity to the bypass may need to be improved to allow road users to access and exit the bypass at locations currently only serviced by existing roads. The additional capital approach could have been applied to TRRIV if the upgrade had been staged so that additional upgrades are planned for when the existing capacity is exceeded. The staging for example could involve improved connectivity to the bypass by adding on/off ramps. Staging would also mean that scope and capital costs for the next stage would have already been considered, thus making the application of the additional capital approach a more realistic alternative as capital costs and scope are not reliant on guesswork. Concepts around compromised capacity in road infrastructure extend to straightforward capacity treatments such as bypasses and the duplication of at or near capacity roadways. For example, Layton (1996), notes concepts of capacity and level of service as important considerations in the analysis of signalised intersections, and further notes VCR (referred to as “V/C ratio”) as a measure of capacity sufficiency. Clearly, building roads with adequate capacity is a key consideration of planning, design and engineering solution implementation. Referring to concepts of both safety and efficient vehicle travel for example, Austroads (2006), notes the “prime requirement for any road is to carry a designated volume of traffic in a safe and efficient manner”. From the perspective of economic efficiency, the most productive allocation of limited capital investment budgets needs to be made. Such investment decisions should be made in a refined, co-ordinated and well considered fashion, as well as a transparent and coherent approach to portfolio investment (Best, 2012). In the case of TRRIV, it was clear through analysis that capacity is constrained along a relatively short distance, with the upgrade falling between two large intersections that feed traffic into and off the existing road sections. For increased accuracy, the existing road sections were broken down in terms of shared characteristics including speed environment and road width, with nine sections examined and modelled. Capacity constraints were apparent in only three of these, implying the need for additional treatment of these road sections as a matter of priority. In addressing this issue, although beyond the scope of this paper, designating future likely corridors allows for appropriate land use planning, and can therefore be viewed as a risk mitigation strategy in identifying all procurements required for the near future, namely appropriate land acquisition. Admittedly, there is nothing new in designating future transport corridors, but early identification avoids additional project risks through minimising any contingency amounts required for land acquisition; thereby reducing risk through minimising settlement pricing through early negotiation. As discussed, the analysed case study had reasonably good information available, although less than perfect. An additional consideration must be around the amount of traffic that would be expected to switch to the bypass, which was estimated at some 40% of existing traffic. A higher realised proportion travelling the bypass would necessarily increase project benefits, and this is feasible as the bypass has adequate capacity to handle additional vehicles. An increase in patronage is an obvious area for generating additional benefits and would easily be tested in future analytical work. Bypass evaluations tend to be more complicated than road projects that build on existing infrastructure. Bypasses tend to change road user behaviour and this change in behaviour requires sufficient modelling before an evaluation can commence. Typically, modelling does not account for all roads affected by the bypass, thus creating discrepancies in the traffic volumes between the base and project case. This problem is compounded when traffic volumes reach capacity in the base case forcing road users to take alternative routes or not travel. This paper proposed and examined a number of different approaches to overcome the problem of traffic volume discrepancies caused primarily by congestion on existing sections of road. Perfect information regarding traffic movements and changes in road user behaviour is rarely available, thus requiring the analyst to apply approaches that best utilise the information available. This paper discussed five approaches from a theoretical perspective and applied three of them to an actual case study. The application of the approaches proved difficult given the limitations of the tools at hand and the very short-term solution offered by TRRIV. The application of approaches to an actual case study proved to be a very useful exercise. The initial approaches were derived based on the theoretical model of a basic evaluation with one existing section and benefits that will last the duration of the asset life. As seen from TRRIV, such an approach does not always represent reality. Some initially appealing solutions prove unworkable. For example, not accounting for VCR impinging on road does not adequately address saturation and reduced vehicle speeds; an arbitrary additional capital amount, without quantified capacity impacts similarly proves unreasonable and unworkable. Critically, many of the bypass projects proposed along the Bruce Highway are likely to present problems similar to those discussed within this paper. Ultimately, it must be the recommendation of this paper to, unsurprisingly, seek out adequate levels of data, have adequate time for analysis and consider the capping of traffic growth at or below a VCR of 1.25 as best practice. This is suggested bearing in mind composition of results and the relative compromising (i.e. undervaluation) of project benefits where VCR and speed-flow interactions are not adequately addressed. An additional contextual recommendation may well be in seeking use of applied economic analysis at a strategic level in order to inform projects at an options analysis phase, rather than after specific project selection investment decisions have been made. If these recommendations are made, the tools used will need to adequately address the problems of applying the discussed approaches. Australian Transport Council (2006): National Guidelines for Transport Systems Management in Australia, 3 Appraisal of initiatives, Commonwealth of Australia, Canberra Austroads (2012), Guide to Project Evaluation – Part 4: Project Evaluation Data (Updated Road User Effects Unit Values), Austroads Austroads (2006), Guide to road design, part 2: design considerations, Austroads Incorporated, Sydney Austroads (2005), Economic Evaluation of Road Investment Proposals: Harmonisation of Non-urban Road User Cost methods, Austroads, AP-R264/05 Best, M. (2012), ‘Application of above average crash rates in road infrastructure cost benefit analysis: a case study example’, paper presented at the Australasian Transport Research Forum, Perth, 26th-28th September Bureau of Transport and Communications Economics (1997), Working Paper 35, Roads 2020, Department of Transport and Regional Development, Canberra Campbell H.F. and Brown R.P.C. (2009), Benefit-cost analysis: Financial and Economic Appraisal Using Spreadsheets, University of Queensland, Brisbane Economic and Finance Committee of the Permanent International Association of Road Congresses (1991), Methods for selecting road investment, Permanent International Association of Road Congresses, Paris Frohlich, P. (2003), Induced Traffic, Review of the explanatory models, Conference Paper SRTC 2003, 3rd Swiss Transport Research Conference Goodwin, P. B. (1996), Empirical evidence on induced traffic, A review and synthesis, Transportation, 23, 35-54, Netherlands Goodwin, P. B., Hass-Klau, C. and Cairns, S. (1998), Evidence of the effects of road capacity reduction on traffic levels, Traffic Engineering and Control, 39, (6), 348-354 Graham, D. J. and Glaister, S. (2011), Road Traffic Demand Elasticity Estimates: A Review, Transport Reviews, 24, (3), 261-274 Layton, R.D. (1996), Use of Volume/Capacity Ratio Versus Delay for Planning and Design Decisions for Signalized Intersections, Discussion Paper #6, prepared for Oregon Department of Transportation, Oregon State University, Salem Lee, D. B., Klein, L. A. and Camus, G. (1999), Induced traffic and Induced Demand, Transportation Research Record, 1659, (99-1478), 68-75 Transport and Main Roads (2013), Strategic Benefit Cost Estimate – Bruce Highway Action Plan Economic Evaluation, Queensland Government, Brisbane (Yet to be published) Transport and Main Roads (2012), Cost Benefit Analysis Report, Townsville Ring Road, Section 4, internally circulated, Brisbane Transport and Main Roads (2011), Cost Benefit Analysis Manual, Queensland Government, Brisbane Yagar, S. (1984), Capacity and Level of Service on Two-Lane Highways (Volume 1), Transportation Technology and Energy Branch, Ontario Ministry of Transportation and Communications, Ontario
Ex = Existing
Net = NetworkTable 3: Breakdown of AADT according to purpose of trip (Project Case Traffic Movements)
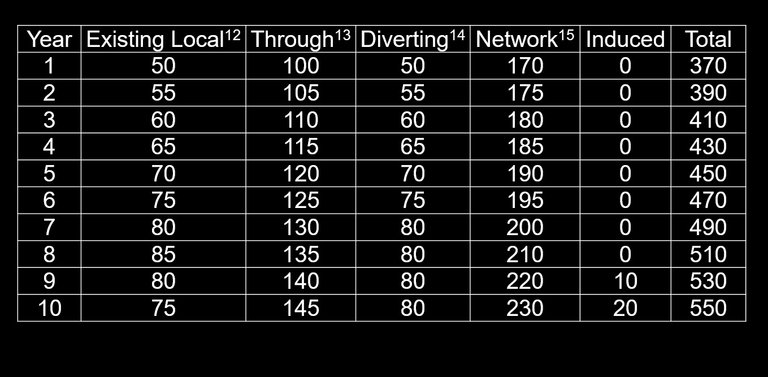
Table 4: Savings per road user according to the purpose of the trip
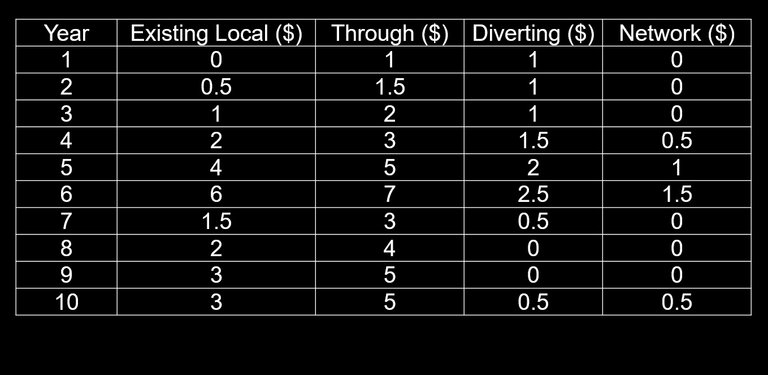
Table 5: Results of sample analysis (Discount Rate of 7%)
3.2. Unconstrained traffic growth
3.3. Additional capital
3.4. Shortened evaluation period
3.5. Limiting traffic growth to VCR – the case for capping traffic growth
Table 6: AADT (Limited Information)
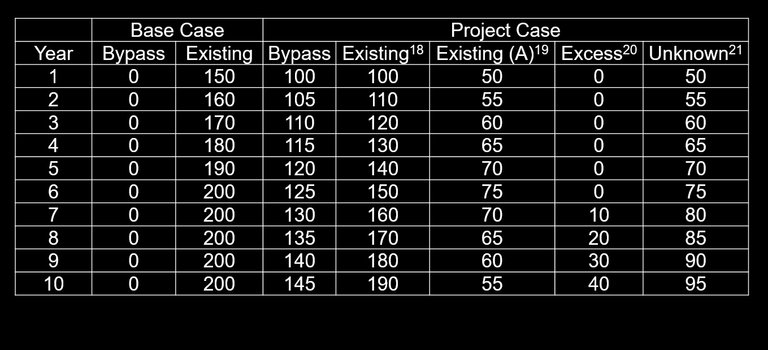
Table 7: Road Users Costs for each year of the evaluation
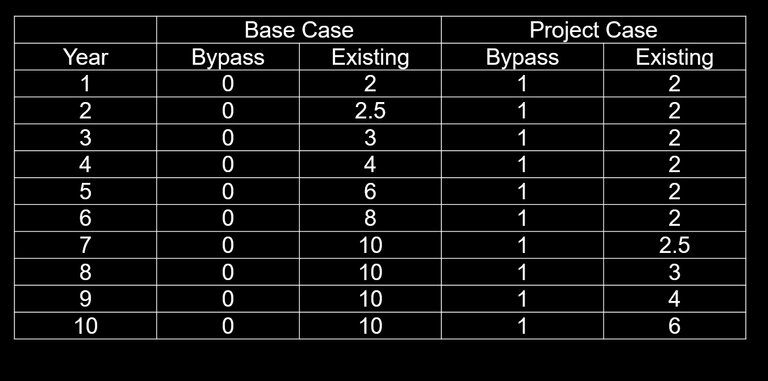
Table 8: Results of Evaluation using the limited growth to VCR approach (Discount Rate of 7%)
3.6. Applying Approaches to a Case Study
Figure 1: Base and Project Case Traffic Volumes for each Approach Applied to TRRIV
3.7. Summary of Approaches
4. Applied Case Study
Table 9: Results of application of alternate approaches, TRRIV (7% discount rate)25
4.1. Limiting traffic growth to VCR – the case for capping (Applied)
4.2. Unconstrained traffic growth (Applied)
4.3. Shortened evaluation period (Applied)
4.4. Additional Discussion Points
5. Conclusion
Appendix A: Summary of Approaches
End Notes
References
Hello @spectrumecons. Was your report prepared for the company you worked for at the time?
The CBA reports were. The paper was prepared for the conference with permission and support from my employer.
Awesome. I had read before that you were an economist, but didn't know the depth of your analytic prowess. Thanks for sharing. Take care.
!LADY
View or trade
LOHtokens.@justclickindiva, you successfully shared 0.0100 LOH with @spectrumecons and you earned 0.0100 LOH as tips. (1/25 calls)
Use !LADY command to share LOH! More details available in this post.