Hi Everyone,

Welcome to the ninth post in my conference and journal paper post series. This series will contain ten conference and journal papers from my time working in the Queensland Government. In my post, My Peer Reviewed Conference and Journal Papers, I explain the purpose of this series.
What Effect do Queensland’s Major Road Infrastructure Projects have on Traffic Volumes and Growth Rates? was my only paper for 2015 and was my final paper I wrote while I was working for Transport and Main Roads. This paper continued along the lines of questioning the value of road and transport projects in Queensland; see my paper from the previous year’s conference where I discuss safety. The growth in traffic volumes on the upgraded roads very quickly erased most of the benefits of reduced congestion. Within a very short time, another upgrade was required; this can be seen with the southern end of the Bruce Highway and the Pacific Motorway.
The paper clearly showed that current transport solutions were ineffective in the long run. The paper should have been used to support other forms of strategies that would reduce the extent of travelling into the city.
The paper was well received by the Australasian Transport Forum (ARTF). Transport and Main Roads were no longer receptive to me presenting at these conferences. If I wanted to attend, I had to fund admission and the trip to the conference myself. I was still dedicated to presenting my research, so I funded myself. Instead of staying for the full conference, I just attended one day and flew back that night. It was not too much of a problem as the conference was held in Sydney, which was just a short flight from Brisbane.
I had now become disconnected from Transport and Main Roads in many ways. Around six months later, I left Transport and Main Roads and joined Building Queensland.
What Effect do Queensland’s Major Road Infrastructure Projects have on Traffic Volumes and Growth Rates?
Abstract
This paper investigates the effect that major road infrastructure projects have on the traffic volumes and traffic growth rates on sections of the network directly affected by the project. The paper also considers whether such changes in traffic volume, possibly induced traffic, influences the economic viability of such major projects.
A sample of major projects located along Queensland highways and motorways have been used in this study. Traffic volumes before and after the completion of the project are compared to determine if traffic volumes and/or traffic growth rates are influenced by the project. The types of major road infrastructure projects considered in the study are town bypasses, deviations, and major road widening projects. Major projects are compared based on a number of factors such as project type, volume capacity ratio at the time of construction, and the extent of the increase in capacity. These comparisons have been used to determine the extent project and network related factors influence changes to traffic volumes and growth rates.
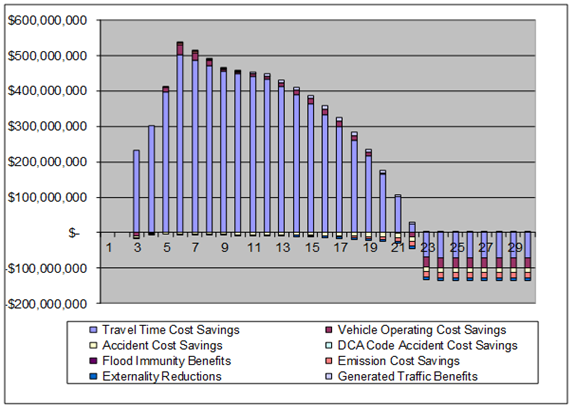
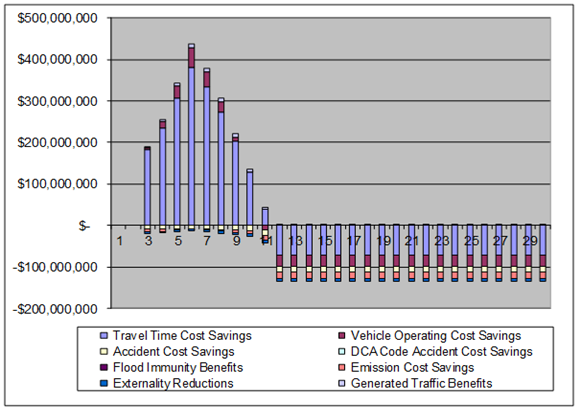
The results of the study aim to determine the extent that induced traffic influences the benefit streams for major projects. Two hypothetical examples have been included in the paper, one example assumes that traffic growth is unaffected by the project and the other example assumes traffic growth follows a pattern similar to the case studies investigated. This paper will discuss the significance of the impact induced traffic has on the economic viability of projects and the types of projects that are more likely to have their benefit streams eroded by induced traffic.
1. Introduction
Typically, in an ex-ante cost benefit analysis, traffic volumes are assumed unaffected by new or upgraded road infrastructure (Bray 2005). It is difficult to measure the extent that new or upgraded road infrastructure can entice new trips or road users to divert from existing infrastructure (Litman 2015). This paper attempts to shed some light on the extent traffic volumes and traffic growth rates are affected by new or upgraded road infrastructure. This paper attempts to draw conclusions from a study of recently completed Queensland major road infrastructure projects1 . As part of the study, a sample of seven major road infrastructure projects have been selected. These projects have been completed in the last fifteen years. The projects have been selected based on location, the nature of the upgrade (mostly to address capacity), and the availability of data. The paper investigates the impacts any changes in traffic volume might have on the cost benefit analysis of a project. These impacts relate to the incorporation of induced traffic in the analysis, and the impact this induced traffic has on the existing traffic.
2. Reasons for the Study
Existing literature generally supports the idea that increased road capacity induces traffic. The standing advisory committee on trunk road assessment (SACTRA) published a paper in 1994; this paper focuses on addressing the question of whether new or upgraded roads generate extra traffic in the context of the United Kingdom. The paper covered four key questions. The questions can be summarized as follows:
• Do improved roads induce traffic?
• If so, are the consequences significant?
• If so, which types of major highway improvement is induced traffic likely to be significant?
• How should current forecasting and appraisal methods be amended to incorporate induced traffic?
The SACTRA paper concluded that evidence generally supported the existence of induced traffic but it was hard to prove unequivocally. Upgraded roads are likely to have a network impact that may build up over time. Upgraded roads may also influence changes in land use, which influences traffic volumes; such induced traffic is difficult to attribute to a project.
In regards to the significance of induced traffic, the United Kingdom’s Department of Transport’s policy stated that induced traffic should not be included as the impacts are not significant2 ; the SACTRA paper does not necessarily agree with this conclusion. The paper also states that excluding induced traffic will overstate the benefits of a project. The paper states that networks operating close to capacity are more likely to induce traffic. The paper recommended that planning should factor the effects of induced traffic at the network level.
Other papers have drawn similar conclusions in the context of the United Kingdom, and the United States of America. Noland (2001) and Duranton and Turner (2011) provide statistical evidence that increasing the number of lanes generates traffic3 in road networks in the United States. They estimated that lane miles have a statistically significant relationship to vehicle miles travelled (VMT). Hansen (1995) draws the conclusion that adding to road capacity will not reduce congestion based on the high sensitivity of VMT to lane miles obtained in his research. Heanue (1998) considers the extent highway capacity influences the amount of traffic generated compared with other factors, which generate traffic. He concluded that increased highway capacity does not have a large impact on the growth of traffic volume.
This paper will explore the questions investigated by SACTRA and other authors but not from a network basis but from the consideration of discrete sections of road. Therefore, changes in traffic volumes on the upgraded roads cannot categorically be stated as induced traffic but might also include traffic diverting from other parts of the network. The volume of diverting traffic for most projects in this study is likely to be minimal, as selected projects have limited viable alternative routes. A broader network analysis has not been adopted in this study because of the lack of available data and access to the necessary transport modelling to make this exercise possible.
Arguments have been made that existing cost benefit analysis (CBA) practices do not adequately consider the impacts induced traffic have on the costs to existing road users. Pfeider and Dieterich (1995) and Metz (2008) question the whole CBA process in regards to the treatment of induced traffic and travel time cost (TTC) savings. They claim that people allocate a fixed amount of time to travelling. If operating speeds are increased, travel time is not reduced as people respond by travelling longer distances or by increasing the number of trips that they make. This extra travel or trips are considered as generated traffic and this additional traffic is usually ignored in cost benefit analysis practices.
This paper aims to address some of the arguments put forward regarding the impact that induced traffic might have on the stream of benefits for a cost benefit analysis. If major road upgrades induce traffic, is the impact of this induced traffic significant? If so, is this significance dependent on the type of project or some other factors?
3. Methodology Applied to the Study
Before considering individual projects and changes in traffic volumes, the overall pattern of traffic growth for the entire network needs to be considered. Changes in traffic volume could be systemic to the network rather than relating to a particular road or upgrade. Figure 1 contains the traffic volumes across the Queensland network from 1965 to 2012 and includes projections out to 2019.
Figure 1: Aggregate Traffic Levels in Queensland
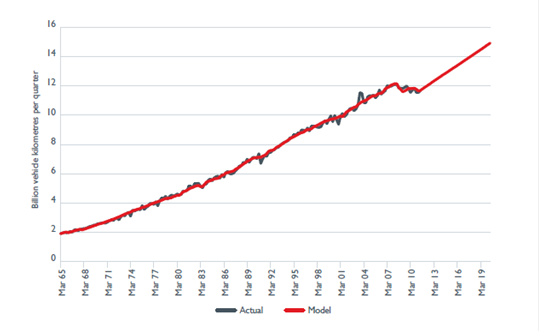
Source: Figure 2.2, Bureau of Infrastructure, Transport and Regional Economics (BITRE 2012)
Traffic growth appears to be consistent and close to linear for most of the last 50 years; 2007 to 2011 is the only period that does not follow that trend with traffic volumes falling slightly. BITRE forecasts that traffic growth will return to a linear pattern from 2012 to 2019. The fall in traffic volume from 2007 to 2011 will be considered when projects are investigated.
The actual traffic volumes collected from project locations will require a yardstick for comparison. An average traffic growth rate has been calculated using the years of data available prior to the construction of the project. Data for most project sites date back to the early 1990s. Any outlier years (high or low) have been excluded from the study. Data for most project sites indicate traffic growth was close to linear and constant, this aligns with the BITRE data for the network. The calculated average was used to estimate traffic volumes from the start of construction to the most recently collected data at the project location. This method has been used to provide the yardstick for comparison to the actual data. These estimated traffic volumes will be referred to as the base case traffic volumes for the project.
The impact of the upgrade and the changes in traffic volume also needs to be measured. This measurement has been made using the volume capacity ratio (VCR). The VCR measures the relationship between volume and capacity (Volume/Capacity). The VCR influences the operating speed, hence the travel time costs. The relationship between VCR, operating speed, and travel time costs is shown in Figure 2. Figure 2 can be used as a point of reference for comparing the VCRs of the case study projects.
Figure 2: Relationship between VCR, operating speed, and Travel Time Costs4
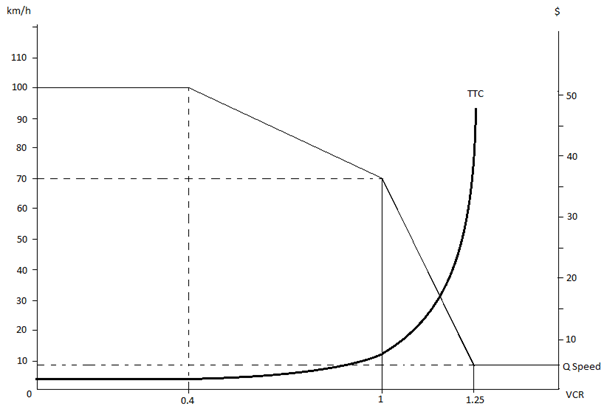
Source: Austroads 2005
Volume has been measured in passenger car units (PCU). A passenger car has a PCU of 1, whereas, a large truck such as a triple road train on a flat gradient has a PCU of 8.8 (TMR 2011). PCUs account for the additional capacity required for larger vehicles. The capacity of the road depends on its model road state (MRS). For highways and motorways, the capacity of each lane is approximately 2,000 vehicles per hour (Austroads 2005). Historical hourly data are not available for most of the projects considered in this paper. Instead, average annual daily traffic (AADT) has been used. The capacity component of the VCR formula can be adjusted to cater for the use of AADT while incorporating the impacts of peak traffic. To do this a capacity factor is used. The recommended capacity factor for national highways is 10% (TMR 2011). Daily capacity is calculated by dividing the hourly capacity by the capacity factor.
4. Projects
In this paper, seven projects have been investigated to determine if traffic volumes and traffic growth rates change after the completion of a major road infrastructure project. Projects have been selected over a 15-year period. Data limitations have prevented the investigation of projects completed before 2000. Table 1 contains the projects investigated in this paper.
Table 1: Major projects considered for study
Project| Capital Cost5 | Year Completed
| Pacific Motorway – 8-laning Logan to Gaven6 | $1480M | 2000
| Pacific Motorway - Tugun Bypass7 | $659M | 2008
| Bruce Highway - Yandina to Cooroy Duplication8 | $170M | 2003
| Bruce Highway - Cooroy to Curra Section B9 | $450M | 2013
| Bruce Highway – 6-laning – Caboolture10 | $140M | 2007
| Warrego Highway - Gatton Bypass Duplication Package 2 & 311 | $71M | 2003
| Gateway Motorway - Gateway Additional Lane Project | $92M | 2014 |
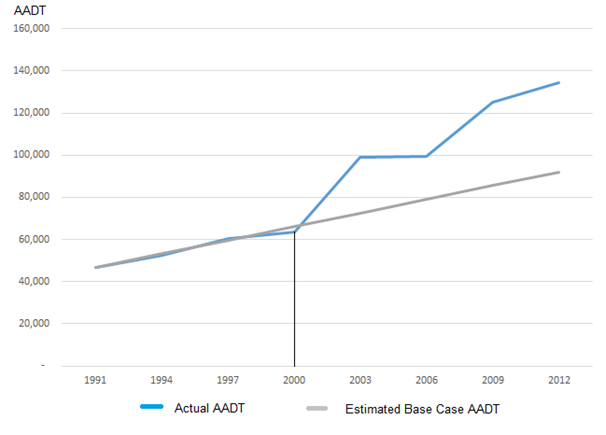
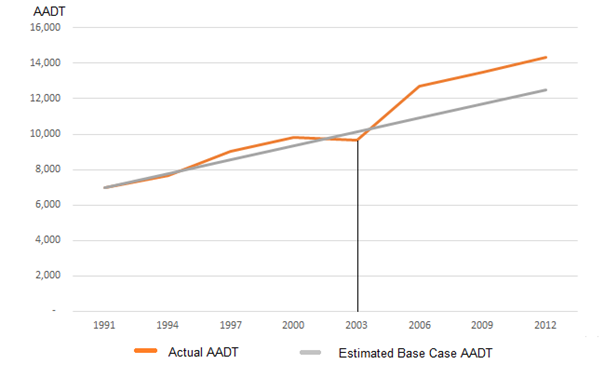
Of the major Queensland highways and motorways, the Pacific Motorway and the Bruce Highway offered the most complete data. There was not sufficient data for other major highways and motorways such as the Ipswich Motorway, Centenary Motorway, and Gateway Motorway. 4.1. Pacific Motorway – 8-laning Logan to GavenThe 8-laning of the Pacific Motorway between Logan and Gaven was a significant project spanning over 36km and costing approximately $1.48 billion in 2014 prices. Queensland Premier Peter Beattie, and Transport and Main Roads Minister Steve Bredhauer commissioned the project on the 6th October 2000. The project offered significant increases to the capacity of the Pacific Motorway. At the time of construction, 170,000 vehicles were projected to use the upgraded motorway by 2020 (DPC 2000). Figure 3 contains the distribution of traffic volume from 1991 to 2012 as well as the base case traffic volumes for that same period. Figure 3: Traffic volumes at the project site of Pacific Motorway Upgrade (Logan to Gaven)
The traffic data suggests a large jump in traffic volume during the 3-year period following the upgrade. Traffic growth remains constant around 2006; this might be explained by the fall in the network traffic growth rate described in the BITRE data provided in Figure 1. The traffic volume jumps again in 2009. From 2009 onwards, the traffic growth rate returns to approximately the same rate as it was prior to the upgrade. Within just a few years, the traffic volume on this section of the Pacific Motorway has increased by more 25% (20,000 more vehicles) than if traffic volume continued to grow at the pre-project level. Volume capacity ratios of this section of road have been calculated before and after the project and if the project did not proceed. The extent of the fall in VCR provides an indication of the extent that the project relieves congestion. Table 2 contains the VCR before and after project completion. Table 2: VCR before and after the Logan to Gaven upgrade
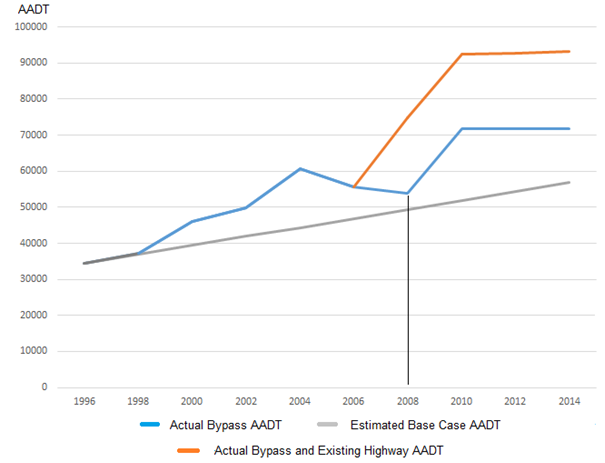
The project initially lowers the VCR for the first few years after the opening of the extra lanes. Three to six years later the VCR exceeds pre-construction levels and is approximately on par with the estimated VCR had the upgrade not taken place. A Brisbane Times article (Moore 2015) supports the evidence suggested by the calculated VCR. This article claimed that this section of the Pacific Motorway is approximately 98 percent choked during peak hours. 4.2. Pacific Motorway – Tugun BypassIn 2008, approximately eight years after the completion of the 8-laning Logan to Gaven project and approximately 25km further south along the Pacific Motorway, the 4-lane Tugun bypass was completed. The Tugun Bypass aimed to provide an essential link between the Southern Gold Coast and Northern New South Wales (DMR 2007). The bypass should allow traffic moving between New South Wales and Queensland to avoid congestion caused by local Gold Coast traffic. The impacts on traffic volumes and growth rates is a little unclear for this project as traffic volume increased between 2000 and 2004. This increase is possibly generated from the Logan to Gaven upgrade. The traffic volumes dropped during the construction of the bypass and then increased on completion of the bypass. The combined traffic usage on the bypass and the existing highway have been considered in measuring the overall traffic volume generated from the project. Figure 4 contains the distribution of traffic volume from 1996 to 2014. Figure 4: Traffic volumes at the project site of Tugun Bypass
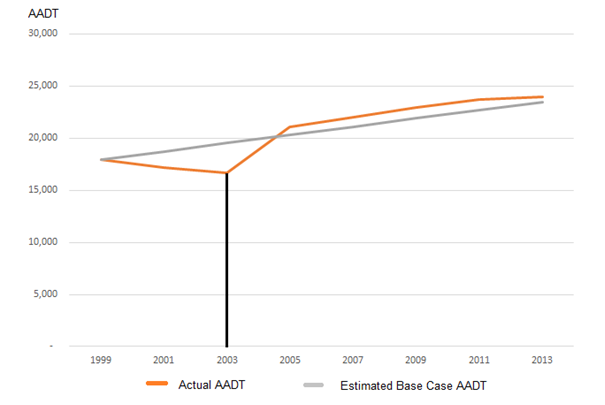
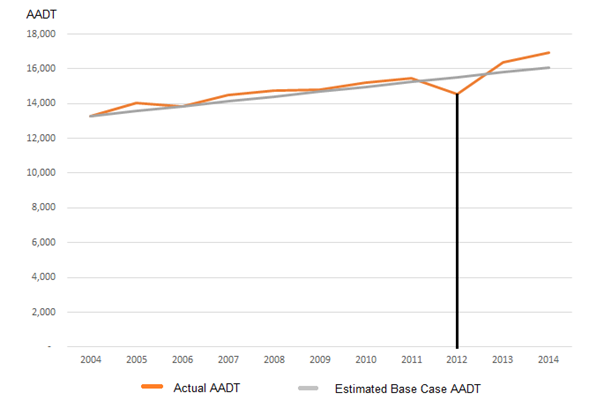
Of the seven case studies considered in this paper, this was the only project that involved the construction of a completely new road. Traffic that used the existing highway has now been divided over the existing highway and the new Bypass. In addition, the effects from the Logan to Gaven project has influenced the traffic volume travelling on the Pacific Motorway. These two factors make it difficult to determine the extent of the change in traffic volume caused by this project. A conservative estimate would be about 20,000 vehicles (difference between the blue line and orange line in Figure 3). The VCR of the Tugun Bypass in 2014 was estimated to be 0.9, which indicates the motorway will soon reach capacity. The estimated base case VCR of the existing highway could not be determined because of the number of intersections. Traffic modelling data is required to determine the traffic flows at each intersection before a valid comparison of congestion can be made. 4.3. Bruce Highway – Yandina to CooroyThe Bruce Highway is another highway considered in this study. Even though the Bruce Highway has lower traffic volumes than the Pacific Motorway, sections have been identified that lack capacity and require upgrading to cater for current and future traffic flows. In 2003, the 2-lane to 4-lane duplication of the Bruce Highway between Yandina and Cooroy was completed. The upgrade was primarily intended to relieve congestion (VCR>1) and improve road safety. The traffic volume dropped during the construction period but climbed on completion. Unlike the increases in traffic volume experienced on the Pacific Motorway, the traffic volume for this project climbed only marginally above the estimated base case traffic volumes. Figure 5 contains the distribution of traffic volume from 1999 to 2013. Figure 5: Traffic volumes at the project site of Bruce Highway (Yandina to Cooroy)12
In 2003, on completion of the project, the VCR dropped from 1.11 to 0.31. Ten years after the completion of the upgrade, the VCR remained below 0.5; this indicates that congestion has not returned. Table 3 contains the VCR before and after project completion. Table 3: VCR before and after the Bruce Highway Duplication between Yandina and Cooroy
In addition to the relief of congestion, upgrading a 2-lane single carriageway to a 4-lane dual carriageway also offers improved road safety by eliminating fatal accidents caused by head-on collisions (RTA 2004). 4.4. Bruce Highway – Cooroy to Curra Section BIn early 2013, ten years after the completion of the Yandina to Corooy duplication and 15km north of Cooroy, Section B of the Cooroy to Curra upgrade was completed. Only two years of data after the construction of this project is currently available. In these two years, traffic volume increased upon opening (mostly compensating for the lower traffic volumes during construction). After this two-year period, the traffic growth rate returned to a rate similar to the pre-construction growth rate. Figure 6 contains the distribution of traffic volume from 2004 to 2014. Figure 6: Traffic volumes at the project site of Bruce Highway (Corooy to Curra Section B)
The moderate increase in traffic volume does not sufficiently increase the VCR to a level that suggests congestion is likely. In 2013, the VCR along Cooroy to Curra Section B dropped from 0.94 (close to capacity) to 0.31. In 2014, the VCR increased to just 0.32; this indicates that this section of road remains relatively congestion free. A few more years of data is required to confirm that traffic volumes will not rise significantly above the estimated base case numbers. Table 4 contains the VCR before and after project completion. Table 4: VCR before and after the Bruce Highway Cooroy to Curra Section B Upgrade
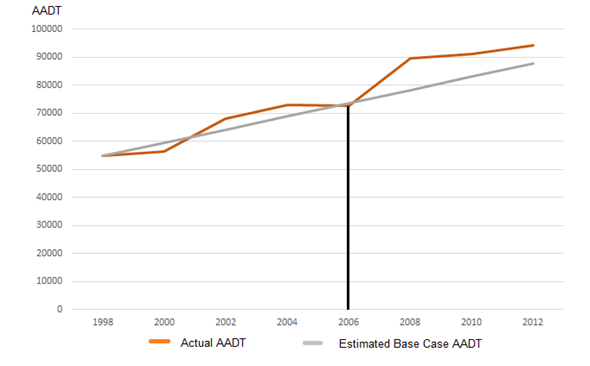
Sections A, C, and D of the Cooroy to Curra Upgrade have not been completed. The traffic volumes along these sections are very similar to Section B and the capacity of these sections are similar as well (TMR 2015a). The upgrade of just Section B seems unlikely to induce more trips as most traffic is required either to travel along the lower capacity Section A or the lower capacity Sections C and D to reach Section B. Revisiting the traffic data on the completion of each of the remaining sections will be necessary to assess the full impact of the whole upgrade. 4.5. Bruce Highway – Caboolture 6-laningIn 2007, seventy kilometres south of Yandina, the Bruce Highway near Caboolture was increased from 4-lanes to 6-lanes. On completion of the project, the traffic volume increased in 2007 and 2008 to about 15,000 vehicles above the estimated base case traffic volumes. The traffic growth rate from 2008 to 2012 is slightly lower than the pre-construction rate. The lower traffic growth rate, over this period, could be attributed to the lower network growth rates described in the BITRE data provided in Figure 1. The increase in traffic volume for this project is greater than the increase in traffic volume of the Bruce Highway projects located further north but less than the Pacific Motorway projects. Figure 7 contains the distribution of traffic volume from 1998 to 2012. Figure 7: Traffic volumes at the project site of Bruce Highway (Caboolture)
In early 2007, on completion of the 6-laning, the VCR dropped from 1.18 (approximately at full capacity) to 0.78 (still high but low enough to allow mostly free flowing traffic). In 2008, the VCR was up to 0.96 (very close to capacity and the onset of congestion). Table 5 contains the VCR before and after project completion. Table 5: VCR before and after the Bruce Highway Caboolture 6-laning Project
The capacity increase of adding 2-lanes does not appear sufficient as a long-term solution to resolving the level of congestion around Caboolture. The lack of additional capacity provided by the project may have also hindered the extent of induced travel as the road reaches saturation. 4.6. Warrego Highway – Gatton Bypass DuplicationThe Warrego Highway can be considered as Queensland’s principal east-west highway (Queensland Government 2015). The Warrego Highway has less traffic than both the Pacific Motorway and the Bruce Highway but is considered an essential freight corridor. The Warrego Highway has a high percentage of heavy vehicles carrying freight for the resources and agriculture industries. The Gatton bypass duplication along the Warrego Highway was open for traffic in 2003. The project cost $46 million in 2003 prices and covered 15km of the existing bypass. The traffic volume took the typical drop during construction followed by an increase in traffic volume once the project opened. In 2006, the increase in traffic volume above the estimated base case traffic volume was small (approximately 2,000 vehicles). From 2006 to 2012, the traffic growth rate reverted to the pre-construction growth rate. Figure 8 contains the distribution of traffic volume from 1991 to 2012. Figure 8: Traffic volumes at the project site of Warrego Highway (Gatton Bypass Duplication)
In 2003, on completion of the duplication, the VCR dropped from 0.6 (mostly free flowing) to 0.18 (completely free flowing). In 2012, the VCR gradually increased to 0.27, which is still well below any level that is expected to cause congestion. In 2012, the VCR in the base case is expected to be close to 0.74, which is reaching the onset of congestion. Table 6 contains the VCR before and after project completion. Table 6: VCR before and after the Warrego Highway Gatton Bypass Duplication
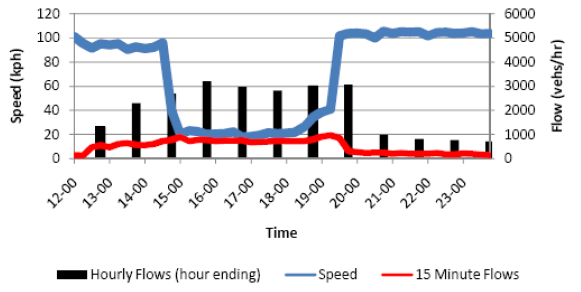
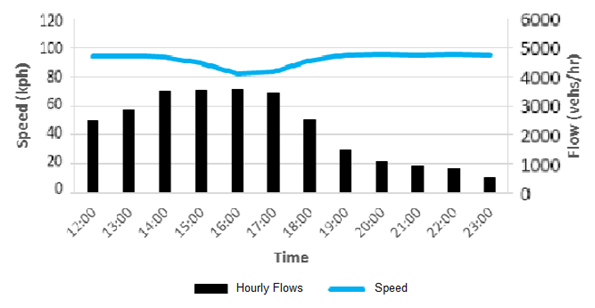
4.7. Gateway Motorway – Gateway Additional Lane ProjectThe Gateway Motorway is a major tolled motorway in Brisbane, Queensland. The Gateway Motorway acts as a bypass of Brisbane allowing for easier access between the Gold Coast and Sunshine Coast (Wikipedia 2015). The Gateway Motorway has a high traffic volume and it has received a number of high capital upgrades. The lack of available traffic data has prevented the inclusion of Gateway Motorway Projects in this paper. The study of the gateway additional lane project relies only upon the data and results presented in the TMR post implementation review. The gateway additional lane project involved the construction of a third northbound lane to ease afternoon peak congestion. Only hourly PM peak traffic volume has been considered in this review. Figure 9 contains the average operating speed during the afternoon peak prior to construction and Figure 10 contains the average operating speed of the project several months post construction. Figure 9: Northbound Gateway PM Traffic Flows (Bicentennial to Sandgate) Pre Construction
Figure 10: Northbound Gateway PM Traffic Flows (Bicentennial to Sandgate) Post Opening
On completion of the project, average PM peak operating speed increased from 20km/h to 83km/h. Maximum peak traffic volume also increased by 17% since the opening of the lane. The additional lane increases the northbound capacity by 50%. The capacity more than compensates for the initial increase in traffic volume. The Gateway Motorway has an approximate annual traffic growth rate of 3%. If we assume the initial traffic volume does not spike further and traffic continues to grow by about 3%, approximately the same level of congestion is likely to reoccur in about 10 years. Evidence from the previous case studies indicates that the spike in traffic growth may take up to 2 years. A post implementation review 2 years after completion would provide a more reliable indication of the extent the project has induced travel and the impact the upgrade has on traffic flows. 4.8. General Findings from the Case StudiesFrom the case studies investigated, a number of important similarities can be drawn. These similarities can be summarized as follows: • Traffic volume dropped during the construction period. The biggest difference between the case studies was the extent of the post-construction increase in traffic volume. The Pacific Motorway 8-laning Logan to Gaven project experienced a 38% increase in traffic volume in the first two-years of operation. Whereas, the Cooroy to Curra Section B only experienced a 17% increase in traffic volume in the first two-years of operation. Table 7 contains the percentage increase in traffic volume in the first 2 years as well as the approximate percentage increase in capacity provided by the upgrades. Table 7: Comparison of changes in volume and capacity two years post-completion
|
|---|
