Hello everyone,
I wanted to share an update on the current state of Hive. 🚀
Source:
Graph data source 👉 binance.com "
Fear & index data source 👉 alternative.me
hive other data source 👉 coingecko.com
Data
🥇rank: 323
📈 Cap: 238902642 usd
📊Vol: 67576054 usd
24H -10.48139%🔴
7D 46.46913%🟢
30D 49.36414%🟢
For more information, you can visit the following links:
🔗 Hive
🔗 Hive Explorer
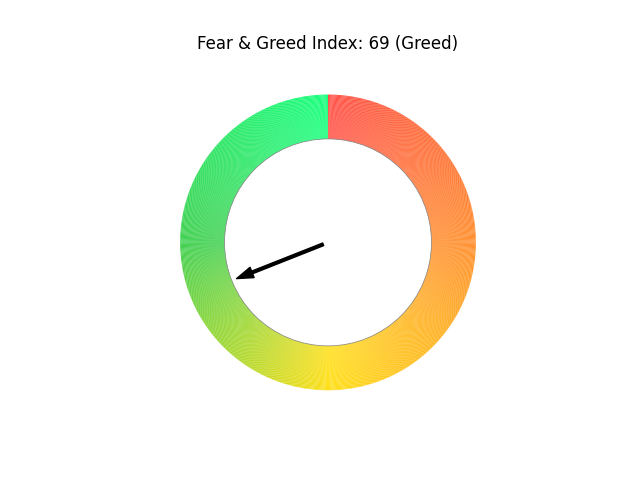
Actual Bitcoin fear & greed index:
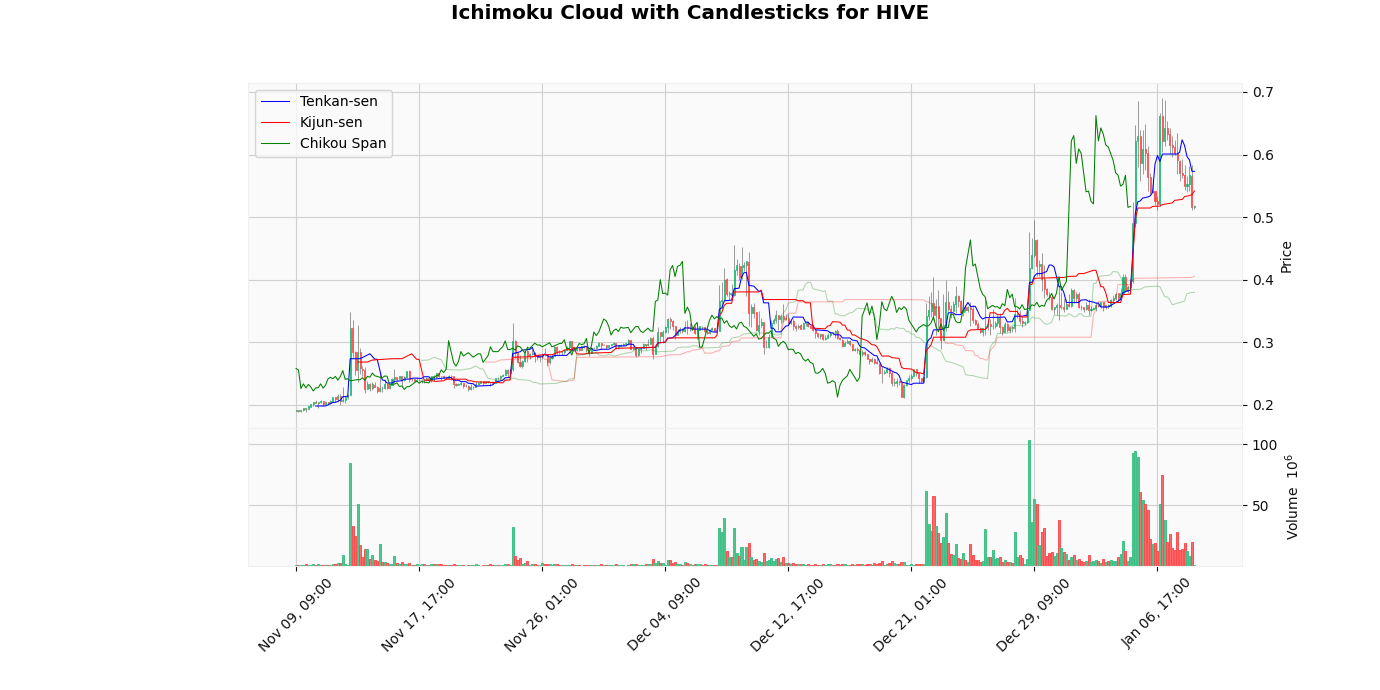
HIVE/USD Market Analysis
- Current Trend: Bearish (Cloud color: 🔴)
- Tenkan-sen: $0.5731 (Price below)
- Kijun-sen: $0.5417 (Price below)
- Support Level: $0.3795
- Resistance Level: $0.4050
- ADX: 20.55 (indicating a strength of trend low)
- RSI: 17.63 (indicate oversold)
- MACD: 0.01, Signal Line: 0.03, Histogram: -0.02
- Volume Strength: -59.33%
Interpretation
The current price of HIVE is located above the level of the Ichimoku cloud, indicating a bearish trend. With a volatility of 88.38%, it is advisable to monitor the price levels around the Tenkan-sen and Kijun-sen to detect signs of strengthening or possible reversal.
Personal Considerations
Bearish Trend
- At the moment, the HIVE market looks weak, with the current price ($0.5169) below the Kijun-sen ($0.5417). This indicates a potential bearish phase.
- The presence of the price below the Ichimoku cloud reinforces the negative trend, suggesting that the bearish is still in control.
- With a volatility of 88.38%, the risk of downward movement remains high. It is important to pay attention to key support at $0.3795 and evaluate any signs of reversal.
- For now, it is best to be cautious and watch if price can find support or if it will continue to lower levels.
Conclusions
- Given the current price of $0.5169, if it continues to respect the support level at $0.3795 and the resistance level at $0.4050, the trend could maintain its current direction.
- However, should the price break below the Tenkan-sen ($0.5731) or the Kijun-sen ($0.5417), it could signal potential weakness in the market, leading to a possible bearish phase.
- Conversely, if the price manages to break above the resistance level, it could indicate a strong bullish momentum, prompting further upward movement.
- The ADX value of 20.55 suggests that the current trend is weak, which should be taken into account when making trading decisions.
- The RSI value of 17.63 indicates that the market is oversold, providing additional context for potential reversals.
- The MACD line at 0.01 crossing above the signal line at 0.03 could indicate a bullish signal, while a cross below could suggest bearish momentum.
- Thus, traders should remain vigilant and consider these levels as critical points for potential entry or exit strategies.
- Monitoring the volatility, currently at 88.38%, will also be essential, as increased volatility may lead to rapid price movements and changes in market sentiment.
Link of analisys: Bitcoin-Fear---Greed-Index---Historical-Data
Link of volume analysis: Hive-Volume-Analysis
