MACD (Moving Average Convergence Divergence) is one of very popular and long-time used indicators that still many traders and investors use.
It has three components: MACD line, Signal line and MACD Histogram.
What makes this indicator useful is the combination of recent trend and momentum in an indicator or a histogram.
MACD line shows recent market trend of the target asset and Signal line shows last several days' momentum that generally 9 days selection is general.
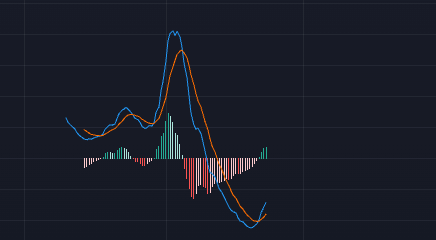 MACD Indicator
When MACD line crosses above Signal line, it means recent trend is bullish. When MACD line crosses below Signal line, bearish trend may come.
Most common and practical application of MACD is to check Divergence.
Bullish Divergence occurs when price moves to lower low, the MACD shows higher low. Bearish Divergence happens when price moves to higher high, the MACD moves to lower high.
MACD may not tell the truth. It is one of useful tools to support traders read and analyze market more conveniently and fast. It may be wrong, so it is required to utilize other information as well to make the correctness of this indicator increase.
To enhance the reliability of MACD signals, traders often combine it with other technical indicators like RSI or volume analysis. This multi-indicator approach can help confirm trends and reduce false signals, providing a more comprehensive view of market conditions.