Many traders and data/financial analysts use MACD as a tool to acknowledge recent trends and to get some hints for upcoming changes.
Every indicator may not be perfect and has its own strengths and weaknesses, so the most important thing to get from this indicator is that I acknowledge the situation and highly possible upcoming changes objectively based on data, not based on emotion.
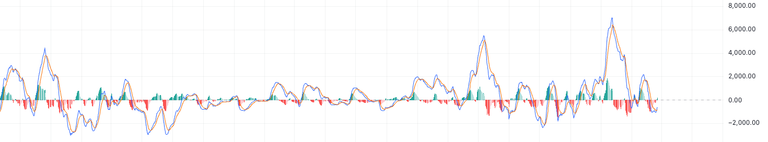
MACD is a tool to know recent trend and momentum and the gap between trend and momentum just in one indicator.
What are the effective uses of this MACD rather than just looking for the MACD line crossing the signal line?
It may be good to apply for Divergence Analysis.
When price makes a new high or low while MACD histogram shows reversal trend, this Divergence may be (or not) a signal for potential price reversal.
After clearly checking this trend, it may be possible to close my whole position or part of position. But if the long-term view includes many practical positive components, it is possible to open hedging positions keeping current positions.
And it is required to check multiple timeframes.
I should combine MACD signals from different timeframes to enhance its analysis reliability.
It is possible to combine a daily chart with weekly or smaller timeframe charts regarding my trading purposes and interval.