
Welcome to the daily financial report about the Hive blockchain.
All the information presented in this report is based on the data collected from the blockchain until 2022-01-15 midnight UTC. This report aims to provide you with a clear view of what is happening on the Hive blockchain.
 Este post está traducido al español - aquí
 Dieser Beitrag ist ins Deutsche übersetzt - hier
 Une version en français de ce post est disponible - ici
1. Price
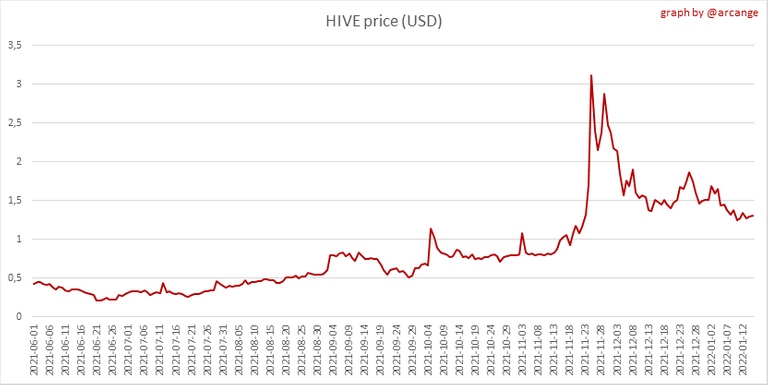 | 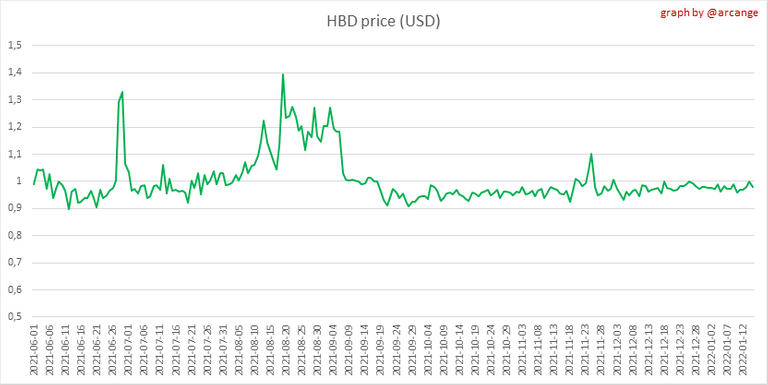 |
These graphs show the evolution of prices in USD for HIVE and HBD.
2. Supply
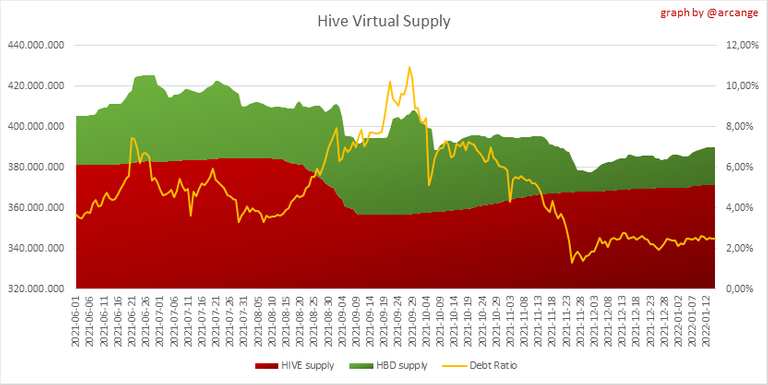
This graph shows the evolution of HIVE virtual Supply. The virtual supply is the sum of HIVE supply (liquid and staked HIVE) and HBD supply (converted into HIVE).
The graph also displays the debt ratio (HBD supply / HIVE virtual supply). Keep in mind that since hardfork 24 funds in the treasury (@hive.fund HBD balance) don't count towards the HBD debt ratio.
 | 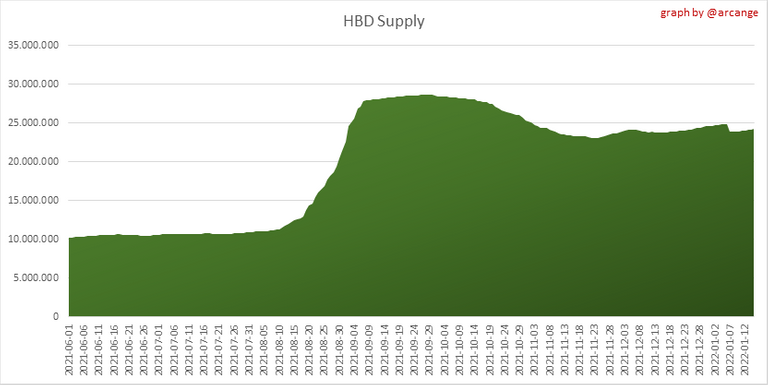 |
These graphs show the evolution of the HIVE Supply (both liquid and staked) and the HBD supply.
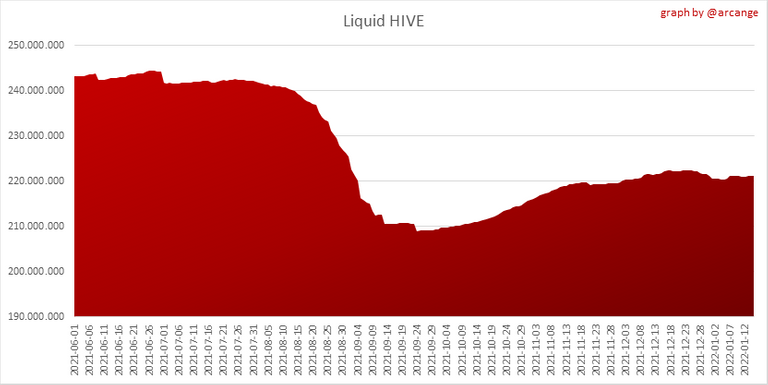 | 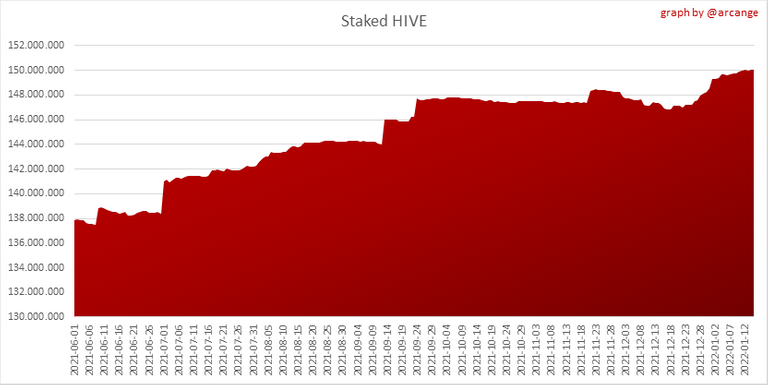 |
These charts show the evolution of the liquid HIVE and the staked HIVE (Hive Power).
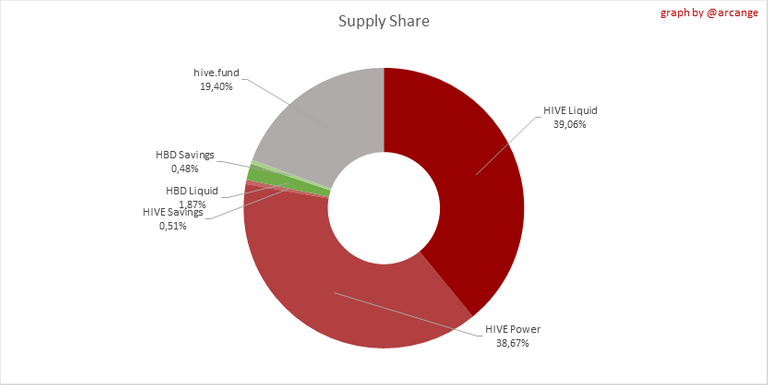
This graph shows the overall Hive tokens distribution.
3. HBD Savings
| Account | Deposit | Account | Withdrawal |
|---|---|---|---|
| @lordbutterfly | 8,750.439 HBD | @somethingfunny | 500.000 HBD |
| @arbys | 1,232.256 HBD | @snook | 220.149 HBD |
| @luislrt | 992.939 HBD | @attentionneeded | 100.000 HBD |
| @empoderat | 990.360 HBD | @bteim | 42.920 HBD |
| @moeenali | 593.991 HBD | @monica-ene | 33.700 HBD |
| @ecency | 508.237 HBD | @carolina38 | 20.000 HBD |
| @world-travel-pro | 501.119 HBD | @juanvegetarian | 19.459 HBD |
| @hiveauth | 324.984 HBD | @latifah1 | 12.945 HBD |
| @muenchen | 223.209 HBD | @dexmark | 8.155 HBD |
| @hivechain.app | 189.984 HBD | @melria06 | 4.583 HBD |
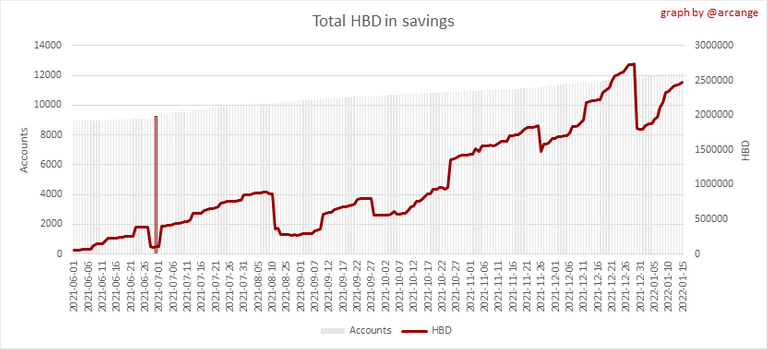
This graph shows how much and how many accounts store HBD in savings. The table below shows the topmost HBD deposits and withdrawals of the day.
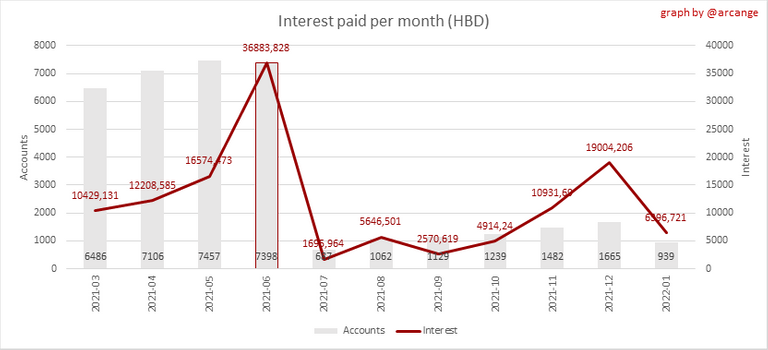
Note: As of 2021-06-30 (HF25) interest is only paid for HBD which are stored in savings.
This chart shows the amount of interest paid each month for holding HBD and how many accounts received such interest.
4. Balances
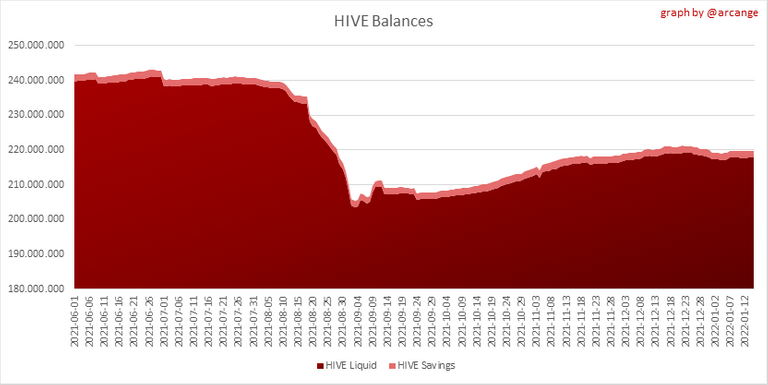
This graph shows the number of HIVE, both liquid and in savings, held by all accounts.
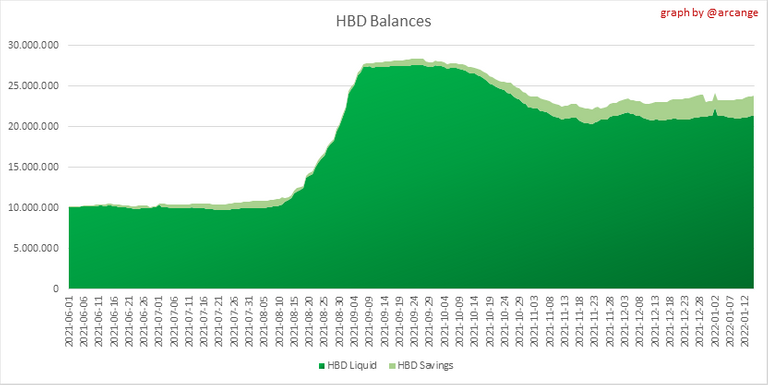
This graph shows the number of HBD, both liquid and in savings, held by all accounts.
5. Conversions
Note: As a reminder, conversion requests are only finalized after 3 days. It is only then that it is known exactly how many HIVE were burned in return for the HBD received at the time of the conversion request.
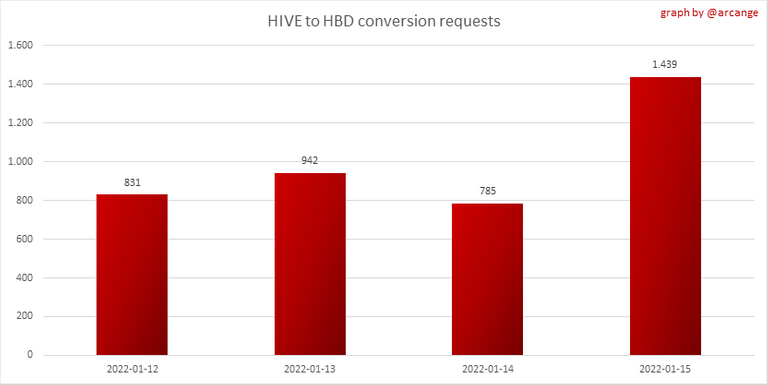
This graph shows the number of HIVE collateralized due to requests to convert HIVE to HBD over the past few days.
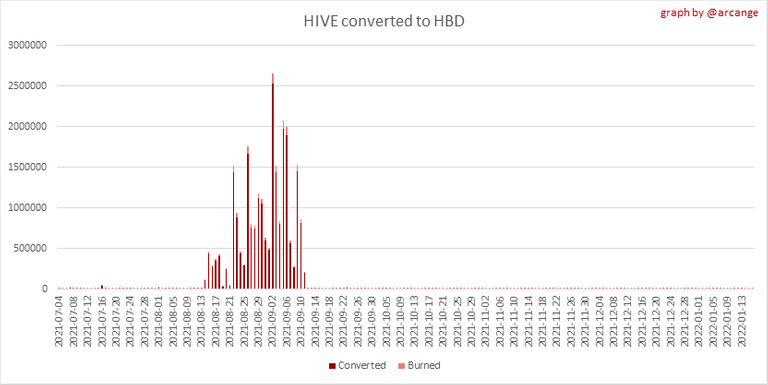 | 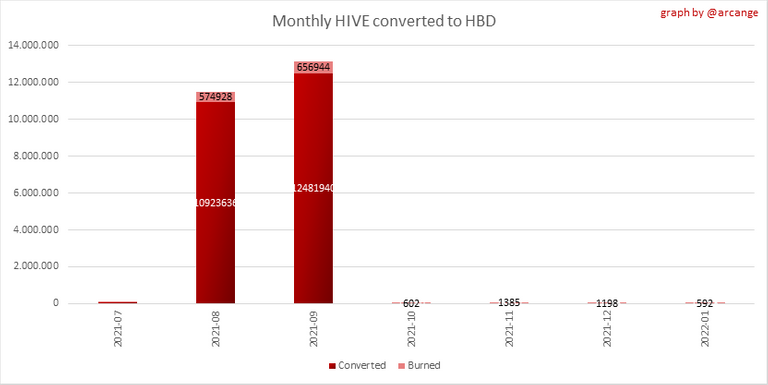 |
These graphs show the number of HIVE effectively used by the conversion process (HIVE converted and 5% HIVE fee which is burned) each day and month when requests to convert HIVE to HBD have been finalized.
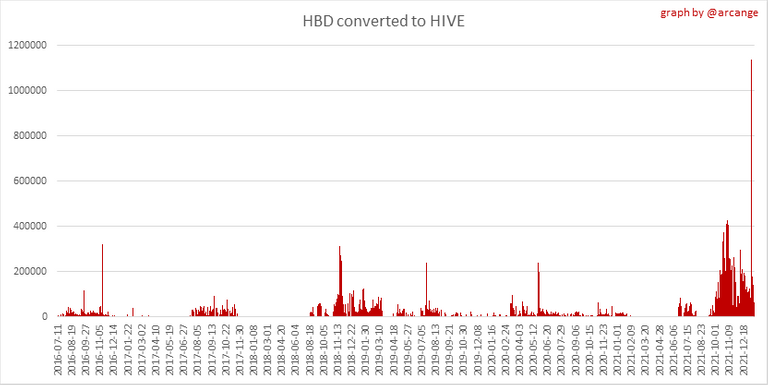 | 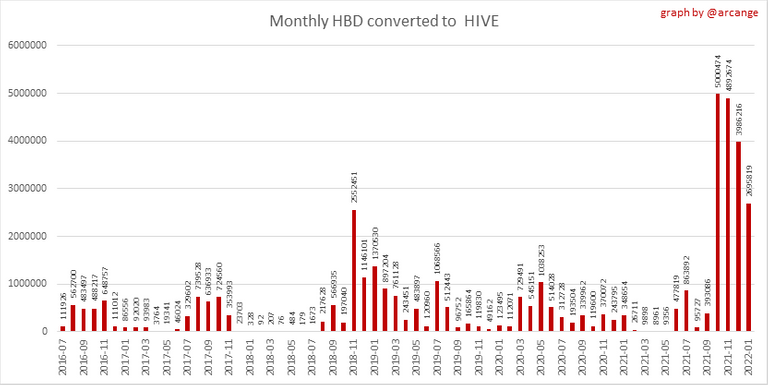 |
These graphs show the number of HBD burned, each day and each month, following requests to convert HBD to HIVE.
6. Powerup and Powerdown
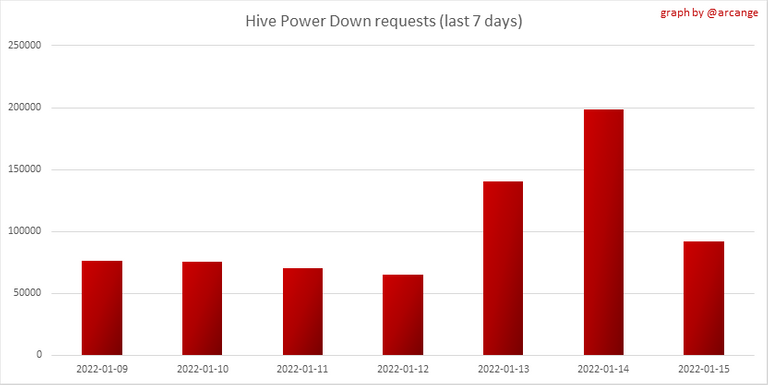
| Date | Account | Amount |
|---|---|---|
| 2022-01-15 10:47:54 | @kevinwong | 28,062.125 HIVE |
| 2022-01-15 11:15:39 | @mammasitta | 15,888.985 HIVE |
| 2022-01-15 09:00:12 | @waivio | 11,000.468 HIVE |
| 2022-01-15 12:00:51 | @solominer | 10,401.152 HIVE |
| 2022-01-15 08:20:24 | @purepinay | 4,640.391 HIVE |
| 2022-01-15 03:41:00 | @iamsaray | 2,385.529 HIVE |
| 2022-01-15 05:34:45 | @atongis | 1,400.075 HIVE |
| 2022-01-15 11:22:42 | @poliwalt10 | 1,326.098 HIVE |
| 2022-01-15 08:38:51 | @georgedonnelly | 1,274.351 HIVE |
| 2022-01-15 12:25:12 | @joythewanderer | 1,211.085 HIVE |
This graph and table show the amount of powerdown initiated over the last 7 days, and the largest initiated on this day.
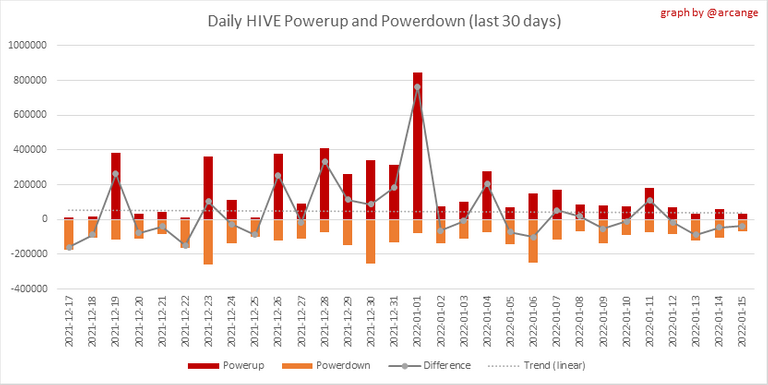
| Account | Powerup | Account | Powerdown |
|---|---|---|---|
| @kevinwong | 25,431.273 HIVE | @ocdb | 14,572.994 HIVE |
| @magicmonk | 2,146.380 HIVE | @encrypt3dbr0k3r | 4,568.757 HIVE |
| @jungheechul | 1,919.980 HIVE | @thejohalfiles | 4,180.500 HIVE |
| @j85063 | 1,000.000 HIVE | @schlees | 2,539.848 HIVE |
| @weggesnackt | 527.060 HIVE | @deanliu | 2,023.419 HIVE |
| @deanliu | 395.000 HIVE | @timcliff | 1,990.069 HIVE |
| @shanghaipreneur | 136.035 HIVE | @glastar | 1,901.136 HIVE |
| @extremecheddar | 104.000 HIVE | @sharkthelion | 1,792.209 HIVE |
| @dune69 | 100.000 HIVE | @hansgans | 1,731.765 HIVE |
| @ihavethedream | 97.308 HIVE | @gniksivart | 1,520.676 HIVE |
This graph shows the daily HIVE power-up, power-down, and the resulting variation over the last 30 days. The table shows the topmost power-ups and power-downs of the day.
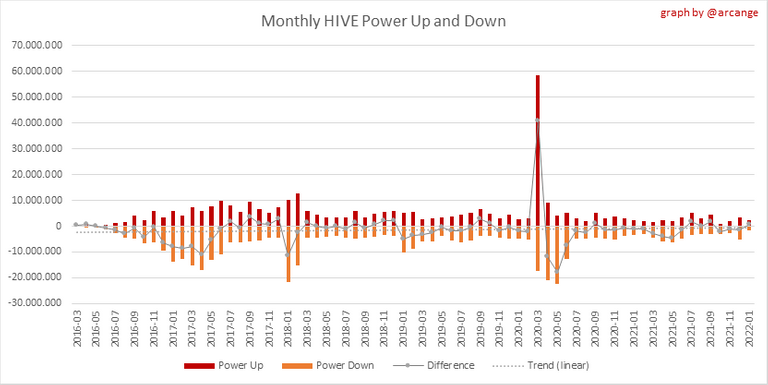
This graph shows the monthly HIVE power-up, power-down and the resulting variation.
Values for the last 3 months
| Period | Powerup | Powerdown | Difference |
|---|---|---|---|
| 2022-01 | 2,313,982.000 | 1,653,071.000 | 660,911.000 |
| 2021-12 | 3,561,589.000 | 5,121,574.000 | -1,559,985.000 |
| 2021-11 | 1,857,545.000 | 2,848,894.000 | -991,349.000 |
7. Transfers
These graphs show the volume (in USD) of HIVE and HBD transferred between accounts.
8. Exchanges
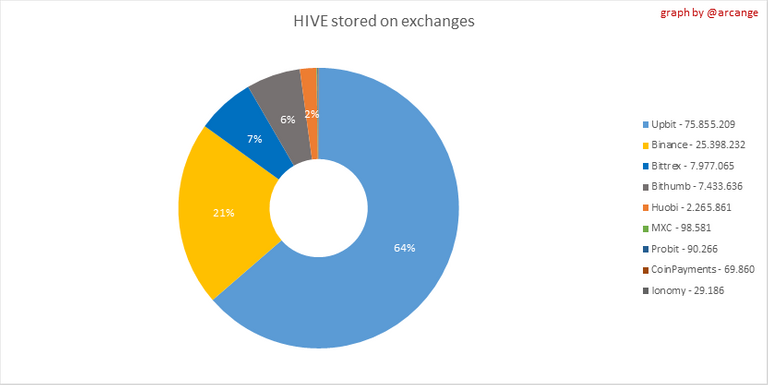 | 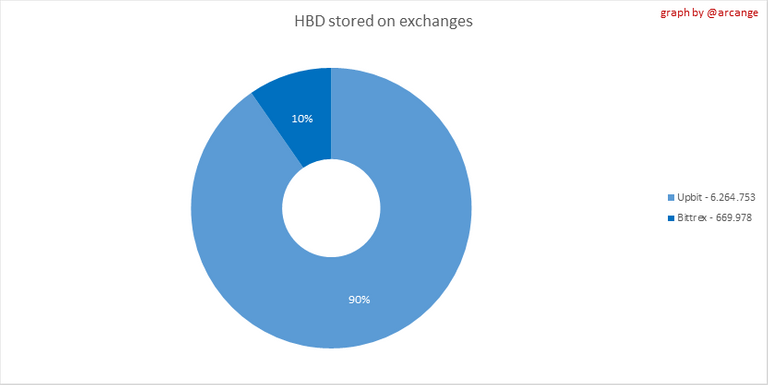 |
These graphs show the amount and distribution of HIVE and HBD stored on the exchanges where they are listed.
 | 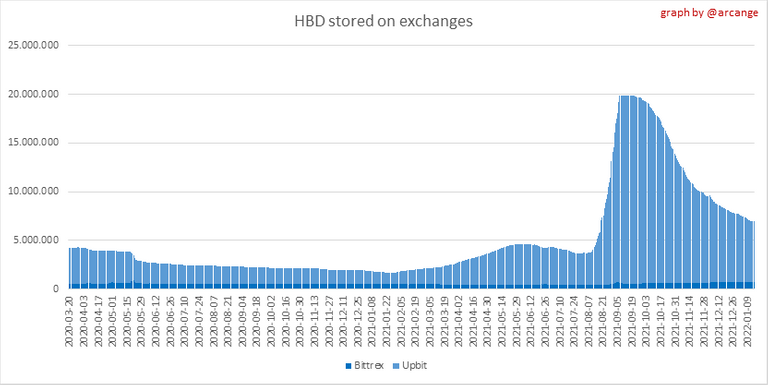 |
These graphs show the daily evolution of HIVE and HBD stored on the exchanges where they are listed.
I hope you find those stats useful. If you would like to see additional stats, feel free to drop me a comment. Your feedback is than welcome.
Thanks for reading.
Check out my apps and services


I will admit my eyes glazed over while looking at all the charts. loll No surprise there but I will say it was interesting enough that I read your post until the end. :D
Is Engage for phones and tablets? I see some people using it for comments.
Thank you for your feedback @snook 🤗
Engage is a web app, so it works on desktops, phones, and tablets.
PIZZA Holders sent $PIZZA tips in this post's comments:
(4/5) @pixresteemer tipped @arcange (x1)
You can now send $PIZZA tips in Discord via tip.cc!
Congratulations @arcange! You have completed the following achievement on the Hive blockchain and have been rewarded with new badge(s):
Your next target is to reach 470000 upvotes.
You can view your badges on your board and compare yourself to others in the Ranking
If you no longer want to receive notifications, reply to this comment with the word
STOPCheck out the last post from @hivebuzz:
This is undoubtedly a good report, I'm glad that people are joining hiveblog daily and earning while same time saving
how do you track all these data. Can we also track ? It's interesting to see how to hive is performing
I use HiveSQL
Thanks, I had no idea abour HiveSQL 😊