
Welcome to the monthly analytical report about the Hive blockchain.
All the information presented in this report is based on the data collected from the blockchain until 2025-03-01 midnight UTC. This report aims to provide you with a clear view of what is happening on the Hive blockchain.
1. New users
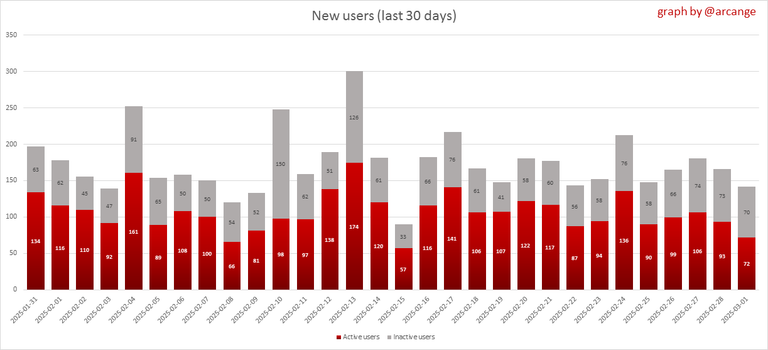
This chart shows the number of newly registered users on the blockchain and how many of them became active. The chart is kind of dynamic! A user can register one day and become active a few days later. Therefore, the number of active users on a specific date may change from day to day.
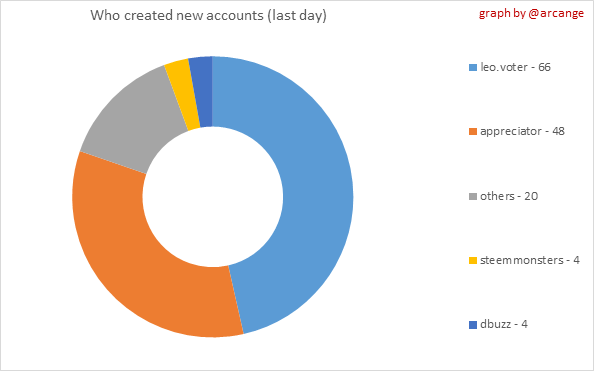 | 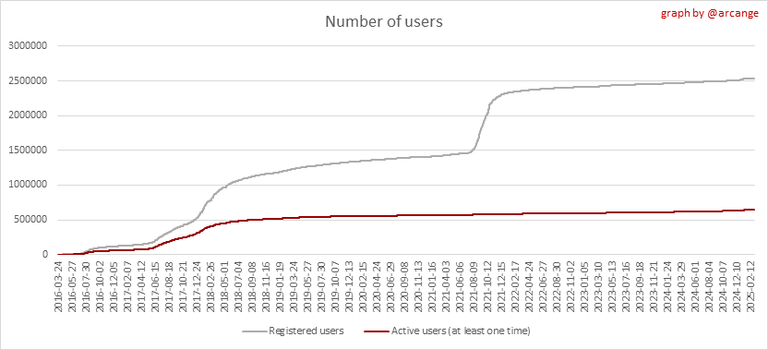 |
These two graphs show who created new accounts during the last day and the total number of registered accounts. The red line shows how many of them have been active at least once (active meaning publishing a post, commenting or voting). They are included even if they become inactive later.
2. Active users
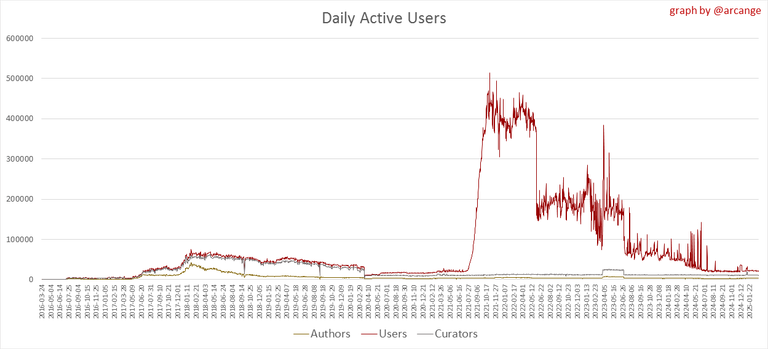 | 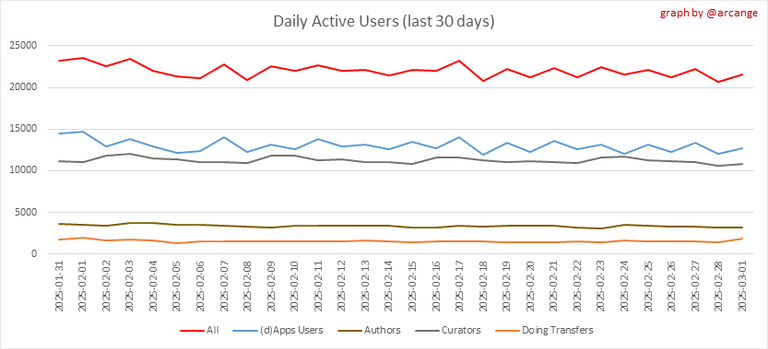 |
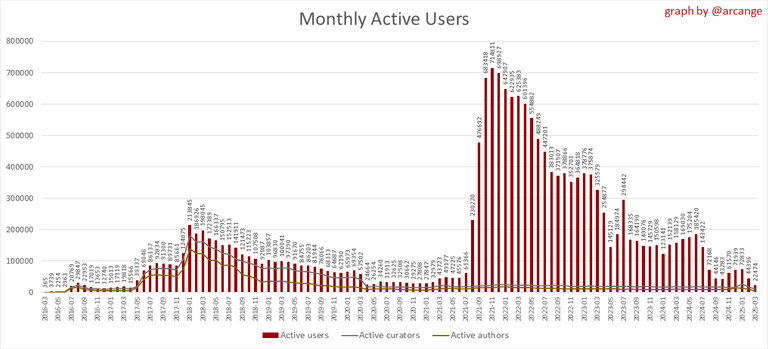
These graphs show the activity of users over time and in more detail the last 30 days. In these graphs, "active users" are those performing any type of transaction on the blockchain.
The last graph is a monthly summary of the active users. Be careful when interpreting the value of the last column which can be much lower if the end of the month has not yet been reached.
3. Apps
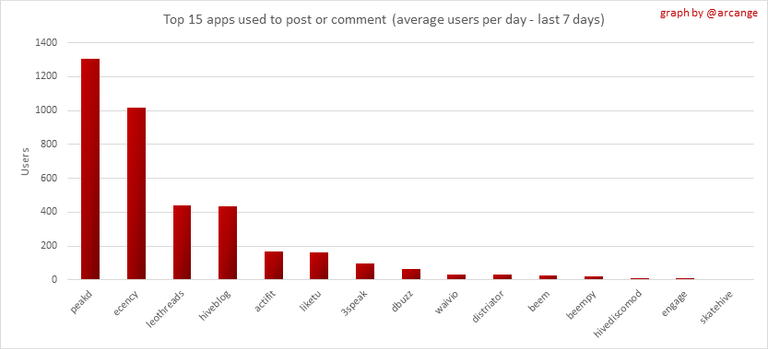
This graph shows which applications are most used to publish posts and comments. Please note that the same user can use several different applications.
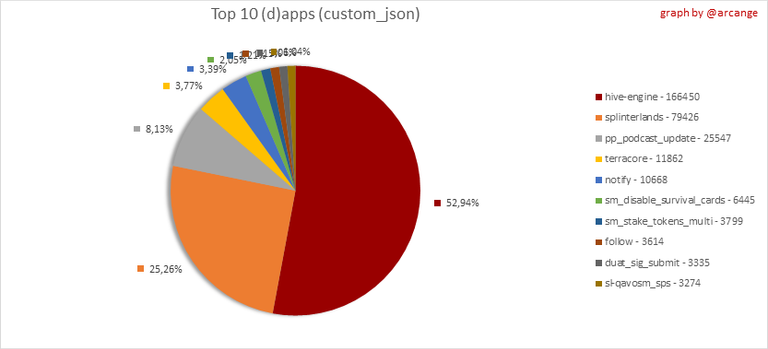
This graph shows which applications generate the most activity (custom_json operations) on the blockchain.
4. Posts And comments
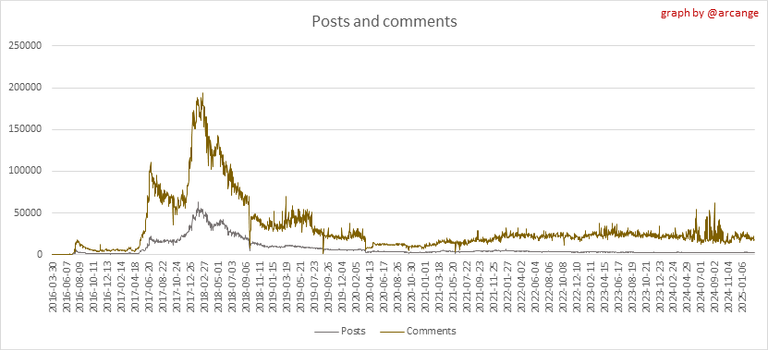 | 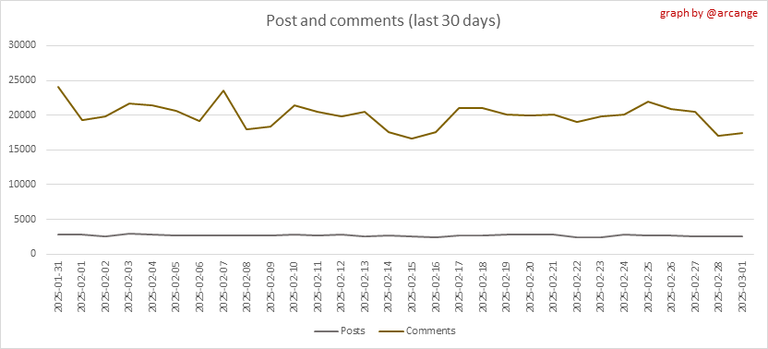 |
These graphs show the evolution of posts and comments for the whole blockchain lifetime and the last 30 days.
5. Curation
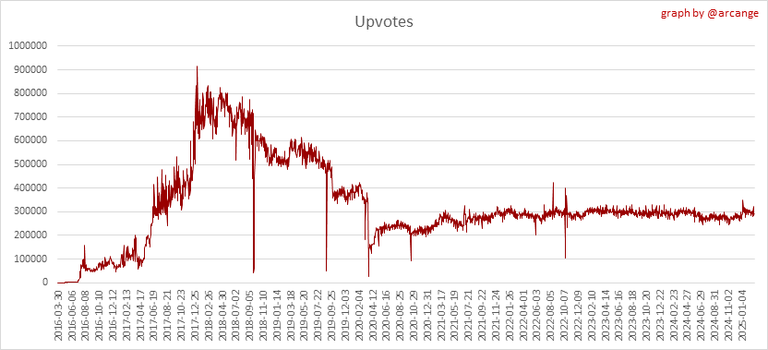 |  |
These graphs show the evolution of curation (upvotes) for the whole blockchain lifetime and the last 30 days.
6. Daily transactions
![]()
These graphs show the number of transactions per day, and the highest number of transactions per block, the average number of transactions per block, and the number of transactions per block for the last 48 hours. This gives you an idea of the whole activity on the blockchain.
![]()
This graph shows the distribution of the top 10 types of transactions by number of operations performed on the blockchain.
7. Communities and Tags

This graph shows the communities with the most subscribers.
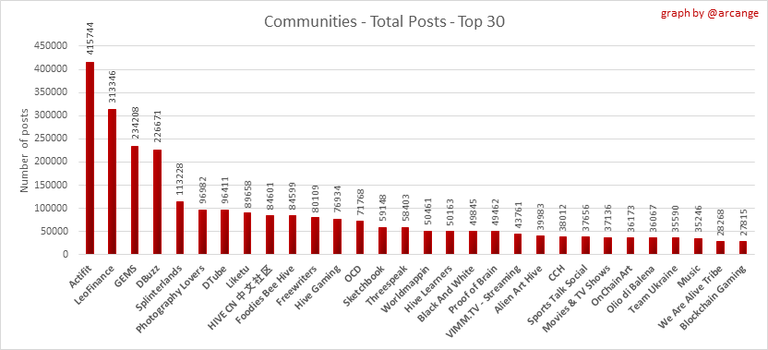 | 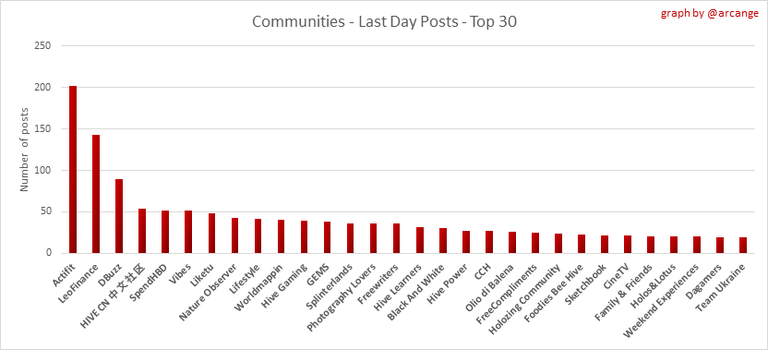 |
These graphs show the most active communities by number of posts (blockchain lifetime and last day).
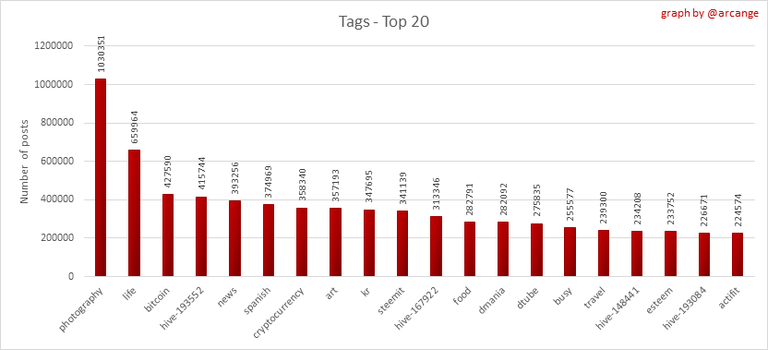 | 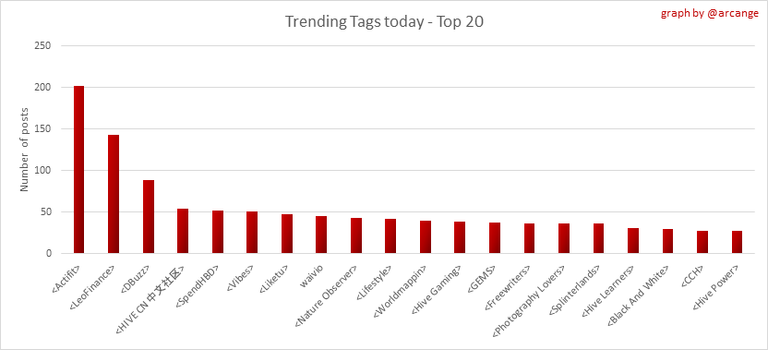 |
These graphs show which main tags have been the most used for publishing posts for the whole blockchain lifetime and the last day.
8. Distribution
 |  |  |  |  |
| < ~594 HP | >= ~594 HP | >= ~5937 HP | >= ~59362 HP | >= ~593620 HP |
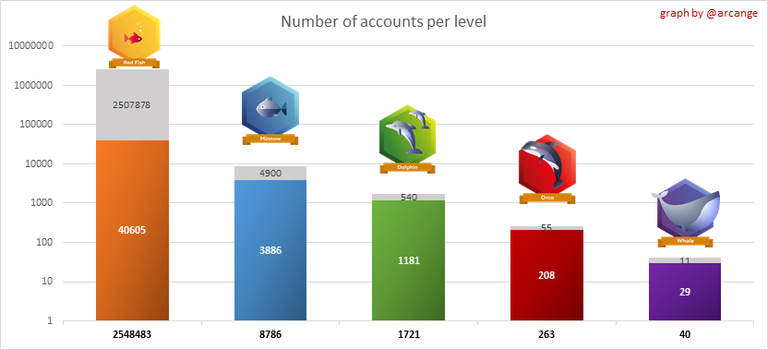 | 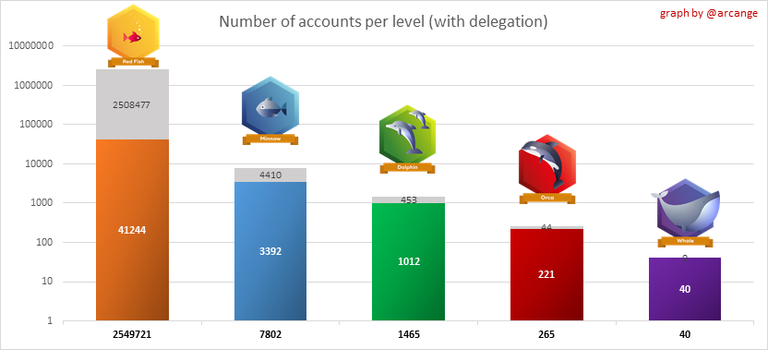 |
These graphs show the number of users according to their Hive Power. The left graph shows the distribution without taking into account any delegation made or received by the accounts. The right graph takes into account delegation, adds received HP delegation and subtracts given HP delegation.
The grey part of each column indicates how many accounts are inactive (those who have not posted, commented or voted the last 30 days).
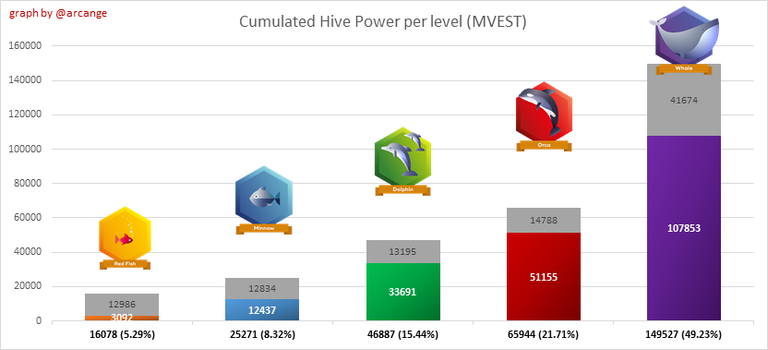 | 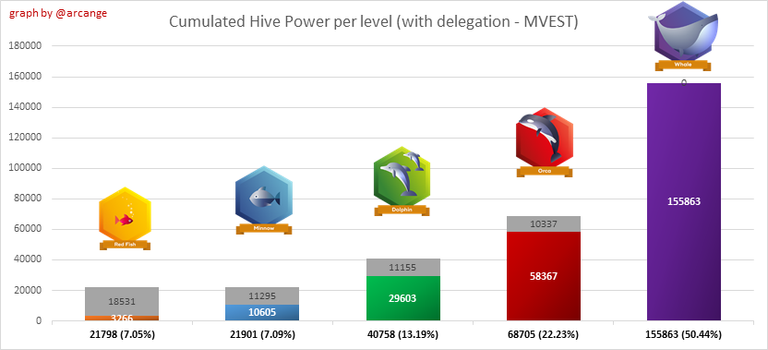 |
This graph shows the distribution of Hive Power cumulated per account level. The left graph shows the distribution without taking into account any delegation made or received by the accounts. The right graphs take into account delegation, adds received HP delegation and subtracts given HP delegation.
The grey part of each column indicates unused Hive Power by inactive accounts (see above the definition of inactive).
Below each column, you will also see a ratio to all existing Hive Power.
9. Payouts
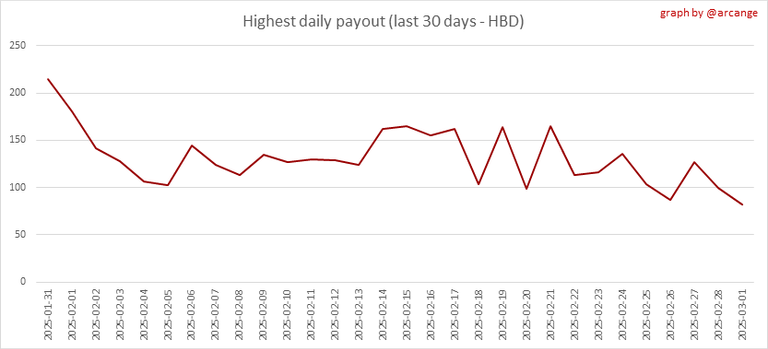
This graph shows the highest reward paid on a post (or comment) for the last 30 days.
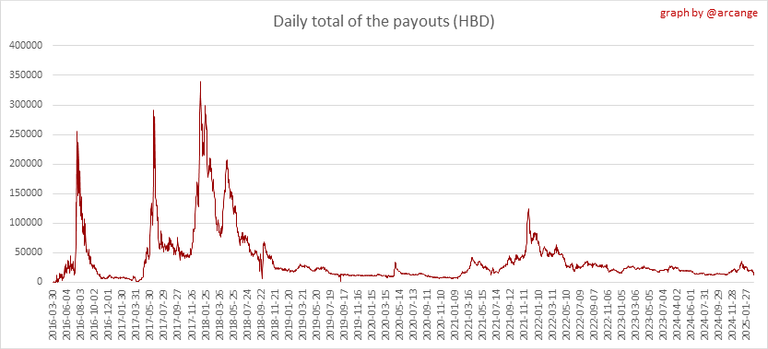 | 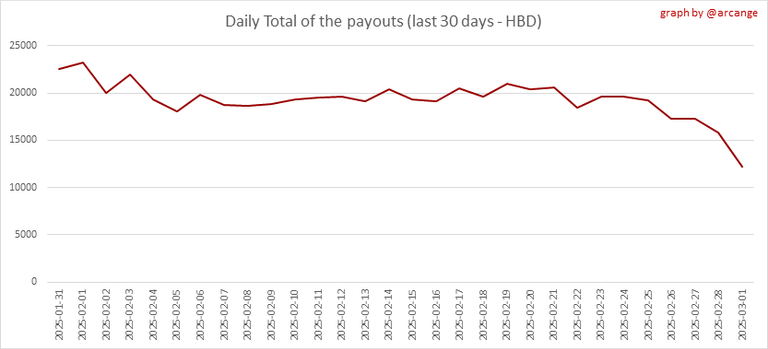 |
These graphs show the total of the distributed payout (posts and comments) for each day.
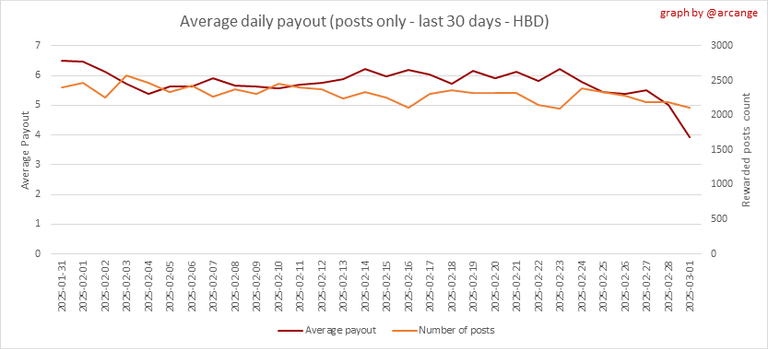 | 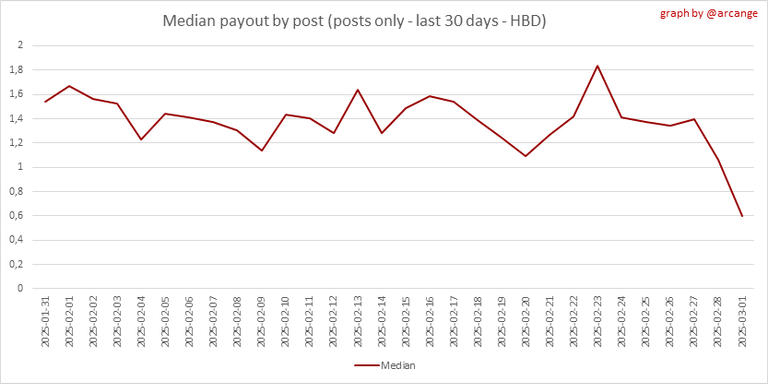 |
These graphs show the average and median payout per post for the last 30 days.
I hope you find those stats useful. If you would like to see additional stats, feel free to drop me a comment. Your feedback is welcome.
Thanks for reading.
Check out my apps and services


I see a drop in minnows and the higher levels (but not whales). Some people are powering down and we need others to stake more. The low price doesn't help, but I hope it can improve.
Cheers for the stats.
The drop in minnows and higher levels is probably influenced by market conditions.
Cheers 🍻
I'm so happy to see you doing these posts again! I absolutely love the amount of detail, and how wide-ranging the data is! Thank you for taking the time to collect and complile all this information! 😁 🙏 💚 ✨ 🤙
You're most welcome, @arcange, of course! I appreciate so much what you do for Hive! 😁🙏💚✨🤙
Ditto. These posts had me come back often
It's fascinating, isn't it? I very much understand why! 😁 🙏 💚 ✨ 🤙
!BEER
That would not long ago was really wild.
!PIZZA
$PIZZA slices delivered:
(7/10) @danzocal tipped @arcange
I dread the day all those bots in the third chart ever get AI'd up and start spamming the network. I appreciate all your diligent work to bring us these stats.
Thanks!
I think over time the price of hive will improve it happens all the time, users drop out bcus they dont know the power of hive yet
This is very useful, thank you for having this kind of blog, now i have a clearer view of tips especially as a newbie like me