Introduction
Welcome back! In my last post, Getting Started with HiveSQL: Crawling Hive Blockchain Data with Python, I showed how easy it is to retrieve data from the Hive blockchain using HiveSQL.
This time, we're going a step further—turning that data into a runnable web app that anyone can access online. We’ll also explore more advanced HiveSQL queries to pull interesting insights.
To follow along, you should have some basic knowledge of GitHub, since we'll be working with repositories. And for building our web app, we’ll use Streamlit—a powerful, lightweight framework for creating Python-based web applications.
🚨 Important Announcement
If you enjoy this content and want to keep using HiveSQL for free, consider supporting this proposal. HiveSQL is an amazing tool for crawling and analyzing Hive blockchain data, and I fully support keeping it available to the community! 😍
A special shoutout to @arcange for the great support—especially when I accidentally blocked my own IP during a test run because I used the actual database instead of my mocked code. Lesson learned! 🤣
What is Streamlit?
Streamlit is an open-source Python library that makes it ridiculously easy to build and share web applications for data visualization and analysis.
With just a few lines of code, you can create interactive dashboards and deploy them online without dealing with complex front-end frameworks. It’s perfect for quickly sharing insights from HiveSQL queries.
Let's Get Started
Structuring the Project
In my previous post, we already covered how to run queries against the HiveSQL database. Now, let's organize the code into a separate module (a standalone Python file).
I've also made a few improvements:
✅ It dynamically determines column names and converts SQL types to Pandas-friendly data types.
✅ It automatically detects which ODBC driver you have installed (thanks to a contribution from @kalkulus ).
Setting Up the Repository
Before diving into the code, make sure you’ve created a GitHub repository to store your project.
I have created for this example the following repository which you can use as reference:
https://github.com/gamerbeaker007/HiveSQL
One important step:
🚨 Never commit your secrets.toml file! 🚨
This file contains sensitive credentials for accessing HiveSQL, so always add it to your .gitignore to prevent it from being uploaded. Keep it only on your local machine for testing.
Setting Up the Streamlit Application
Choosing a Python IDE
You can use any Python IDE (Integrated Development Environment) for this project. I personally use PyCharm from JetBrains. The free Community Edition is more than enough for this use case. If you prefer, you can also use VS Code, Jupyter Notebook, or any other Python editor you're comfortable with.
Installing Required Packages
Before diving into the code, let’s install the necessary Python packages. Open a terminal and run:
pip install pypyodbc pandas plotly streamlit
- pypyodbc → Connects to the HiveSQL database
- pandas → Handles and processes tabular data
- plotly → Enables interactive charts and visualizations
- streamlit → Builds the web app
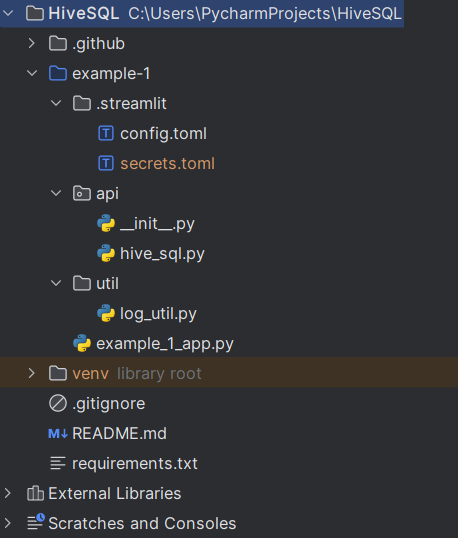
Important Files in a Streamlit Project
Let’s go over some key files that help set up our Streamlit application.
1️⃣ config.toml – Streamlit Configuration
This file controls how Streamlit runs locally. For example, it can auto-refresh when you update your code, so you don’t have to restart the server manually.
# <div class=phishy>Needed for local development with Docker  </div>
[server]
runOnSave = true
headless = true
fileWatcherType = "poll"
- runOnSave = true → Automatically refreshes the app when you modify the code (no need to restart the server).
- headless = true → Prevents a new browser window from opening every time you restart the server.
- fileWatcherType = "poll" → Ensures file changes are detected when runOnSave is enabled.
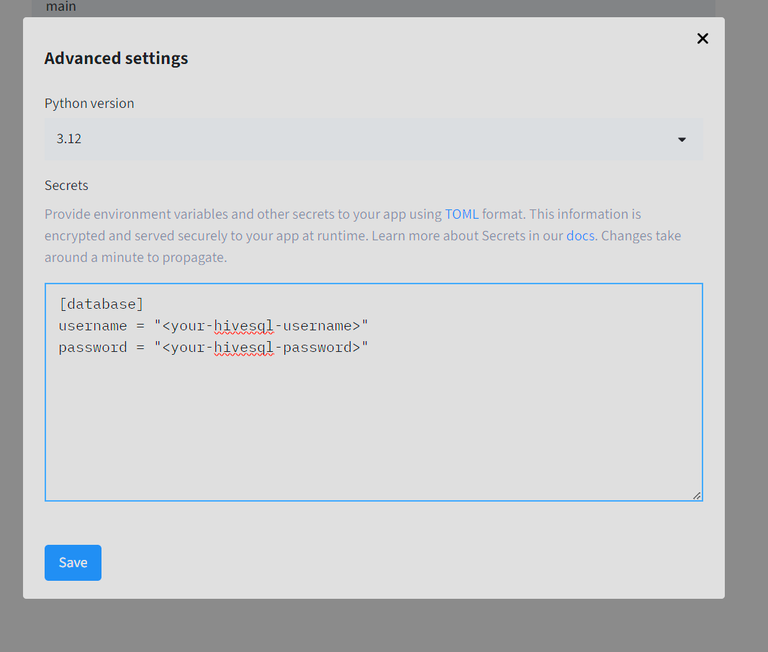
2️⃣ secrets.toml – Store Sensitive Credentials
This file contains sensitive information (like your HiveSQL username and password) that should never be committed to GitHub. Always add this file to .gitignore (more on that below).
[database]
username = "<your-hivesql-username>"
password = "<your-hivesql-password>"
💡 Tip: Keeping your credentials in secrets.toml ensures they remain private and secure.
3️⃣ hive_sql.py – Query Execution Module
This file contains the execute_query_df function from the previous blog, which runs queries against HiveSQL and returns the results as a Pandas DataFrame. We’re keeping it separate so we can reuse it across different applications.
4️⃣ log_util.py – Logging Utility
This optional module sets up a logger to help you debug and track issues when the application is running. It’s especially useful after deploying your Streamlit app, as it helps you see what's happening behind the scenes.
5️⃣ example_1_app.py – The Main Streamlit Application
This is the actual Streamlit app where we define the interface and display HiveSQL data. We'll take a deeper look at this in the next section.
6️⃣ .gitignore – Prevent Unwanted Files from Being Committed
This file tells Git which files should NOT be uploaded to your GitHub repository.
Example .gitignore file:
/venv/
/**/secrets.toml
/.idea/
- /venv/ → Excludes the virtual environment directory
- /**/secrets.toml → Ensures credentials are never committed
- /.idea/ → Excludes PyCharm project-specific files
7️⃣ requirements.txt – Dependencies for Deployment
This file lists all the Python packages required to run your application.
# streamlit~=1.41.1

pandas~=2.2.3
pypyodbc~=1.3.6
plotly~=5.24.1
💡 Note: Streamlit itself is not included in requirements.txt because it’s automatically provided by the Streamlit deployment platform.
What's Next?
Now that we have a structured project, in the next section, we’ll dive into the Streamlit application code and build an interactive dashboard for HiveSQL data. 🚀
Understanding example_1_app.py
The example_1_app.py file contains the complete Streamlit application that will be deployed. Let's break it down step by step.
1️⃣import logging
import plotly.express as px
import streamlit as st
from api import hive_sql
from util import log_util
2️⃣log_util.config_logger()
log = logging.getLogger("Example 1")
3️⃣st.set_page_config(layout="wide")
4️⃣st.title("Lets start with Example 1 Streamlit 🎉")
st.markdown("""
In this first example, we will combine the previous tutorial
on your first query with building a simple single-page application\n
We'll also demonstrate how easy it is to deploy using Streamlit.
""")
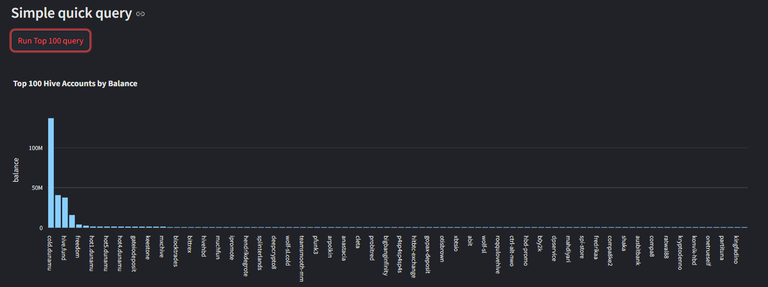
st.subheader("Simple quick query")
5️⃣if st.button("Run Top 100 query"):
log.info("Run Top 100 query")
6️⃣df = hive_sql.execute_query_df("""
SELECT TOP 100 name, balance
FROM Accounts
WHERE balance > 1000
ORDER BY balance DESC;
""")
7️⃣if df.empty:
log.error("No query result")
else:
log.info(f"Query result rows: {df.index.size}")
fig = px.bar(df, x='name', y='balance', title="Top 100 Hive Accounts by Balance")
8️⃣st.plotly_chart(fig, theme="streamlit")
🛠️ Breaking Down the Code
1️⃣ Importing Required Modules
logging → Helps track errors and debugging information.
plotly.express → Used for interactive charts and visualizations.
streamlit → Our web app framework.
hive_sql → Our module that handles HiveSQL queries.
log_util → Our custom logger to track actions.
2️⃣ Setting Up the Logger (Optional)
Initializes a logger to track when the query is run.
Useful for debugging and logging errors when the app is deployed.
3️⃣ Setting the Page Layout (Optional)
layout="wide" → Expands the app to use the full width of the screen.
Default layout is centered, but wide mode makes data visualizations easier to read.
4️⃣ Adding a Title and Description
Sets the main title at the top of the page.
st.markdown() allows for multi-line text formatting.
Uses Markdown for styling (new lines, bold text, links, etc.).
Provides an introduction to the app.
5️⃣ Adding a Query Button
Creates a button labeled "Run Top 100 query".
When clicked, it logs the action and executes the HiveSQL query.
6️⃣ Executing the HiveSQL Query
Runs a HiveSQL query to get the top 100 accounts with a balance greater than 1000.
The query result is stored in a Pandas DataFrame (df).
7️⃣ Handling Query Results
If no results are returned, logs an error.
If results are found, logs the number of rows retrieved.
8️⃣ Displaying the Query Results as a Chart
Uses Plotly to generate a bar chart.
X-axis: Account name
Y-axis: Account balance
st.plotly_chart(fig) displays the chart in the Streamlit app.
🎁Bonus: More Advanced Query
For those who want to dig deeper, here’s a more advanced HiveSQL query that provides a richer dataset.
This time, when you press the button, a spinner will appear to indicate that data is being fetched. The query results are then processed, and we calculate the share of HP (Hive Power) per community.
🔍 What Does This Query Do?
- Fetches all Hive communities and their subscribed members.
- Retrieves the HP (Hive Power) of each member.
- Aggregates the total HP per community by summing up the HP of its members.
- Groups the results by community.
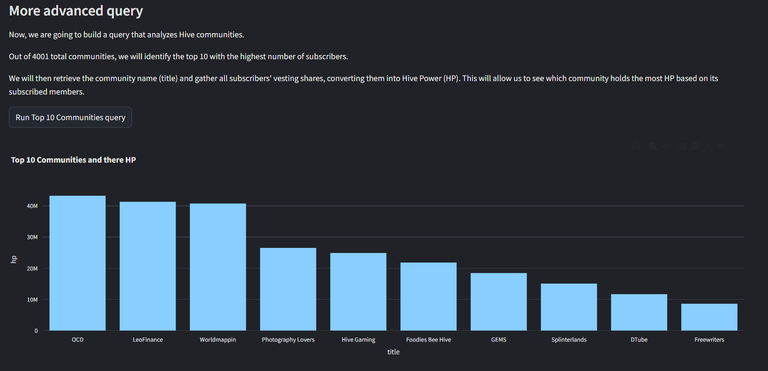
- Displays a bar chart of the top 10 communities holding the most HP.
st.subheader("More advanced query")

number_of_communities = hive_sql.execute_query_df("SELECT COUNT(name) as count FROM Communities").iloc[0]['count']
st.markdown(f"""
Now, we are going to build a query that analyzes Hive communities. \n
Out of {number_of_communities} total communities, we will identify the top 10 with the highest number of subscribers.\n
We will then retrieve the community name (title) and gather all subscribers' vesting shares,
converting them into Hive Power (HP). This will allow us to see which community holds the most HP based on its subscribed members.
""")

if st.button("Run Top 10 Communities query"):
    log.info("Run Top 10 Communities query")

    with st.spinner("Loading data... this can take a while"):
        df = hive_sql.execute_query_df("""
        WITH TopCommunities AS (
            SELECT TOP 10 community, COUNT(subscriber) AS subscriber_count
            FROM CommunitiesSubscribers
            GROUP BY community
            ORDER BY subscriber_count DESC
        ),
        CommunityMembers AS (
            SELECT cs.community, cs.subscriber AS account_name
            FROM CommunitiesSubscribers cs
            JOIN TopCommunities tc ON cs.community = tc.community
        )
        SELECT cm.account_name, cm.community, c.title, a.vesting_shares
        FROM CommunityMembers cm
        JOIN Communities c ON cm.community = c.name
        JOIN Accounts a ON cm.account_name = a.name;
        """)

        conversion_factor = hive_sql.get_hive_per_mvest() / 1e6
        df["hp"] = conversion_factor * df["vesting_shares"]

        df = df.groupby('title', as_index=False)['hp'].sum()
        df = df.sort_values(by='hp', ascending=False).reset_index(drop=True)

        fig = px.bar(df, x='title', y='hp', title="Top 10 Communities and there HP")
        st.plotly_chart(fig, theme="streamlit")
🚀 How to Deploy Your Streamlit App
Now that we’ve gone through the code, it’s time to run it yourself and even deploy it online so others can access it!
🏃 Running the App Locally
To test your app locally, open your terminal and navigate to the application directory (inside your repository). Then run:
cd HiveSQL/example-1
streamlit run example_1_app.py
📌 Why navigate to the folder first?
If your repository contains multiple applications, you need to make sure you’re in the right directory before running the command.
Once the app starts, open your browser and go to:
👉 http://localhost:8501/
You should now see your HiveSQL Streamlit app running on your machine! 🎉
🌍 Deploying Your App Online
The real fun begins when we deploy the app so others can use it! Follow these simple steps to deploy your Streamlit app with just a few clicks.
1️⃣ Commit Your Code to GitHub
Make sure all your changes are pushed to GitHub.
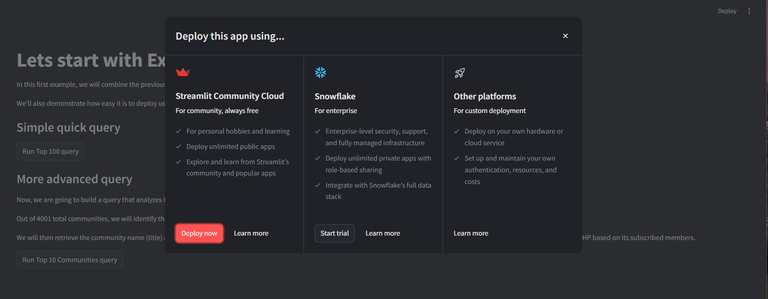
3️⃣ Create a New Deployment
In your locally running app you can start deploying the app
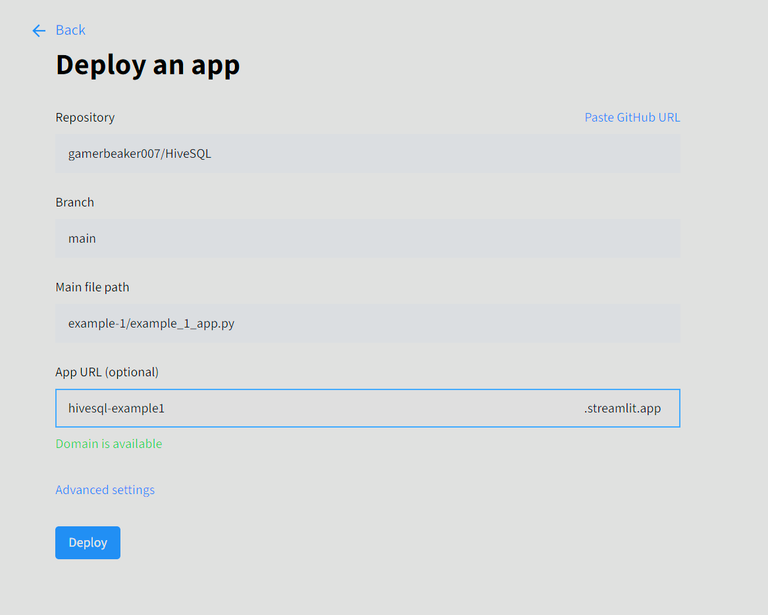
Here is the live running app of this example:
https://hivesql-example1.streamlit.app/
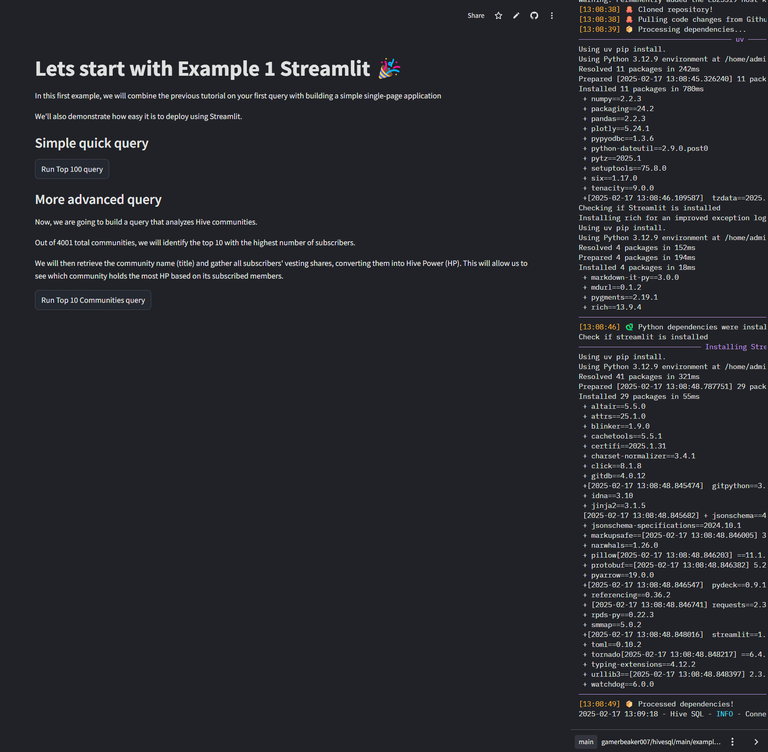
Viewing Logs & Monitoring
Once deployed, you can check your app’s logs (only visible to you).
Waking Up a Stopped App
If your app isn’t used for a while, Streamlit automatically stops it to save resources. If this happens, you’ll see this screen:
No worries! Just click "Wake Up", and your app will be back online.
Closing Notes
At first glance, this might seem like a lot of steps, but once you get the hang of it, it’s actually pretty easy! 🚀
Streamlit is incredibly powerful, and this is just the beginning—you can build much more complex applications with interactive features, dashboards, and even machine learning models.
💡 Using AI to Make Things Easier
If you're ever stuck on something, don’t hesitate to use AI!
Need help with Streamlit? Ask ChatGPT to generate sample code.
Struggling with a SQL query? AI can suggest optimized queries.
Debugging issues? AI can help explain errors and suggest fixes.
💡 Pro Tip: Always try to understand the AI-generated code before copying and pasting it. If you don’t take the time to learn how it works, you’ll struggle when things break or need tweaking. Make it a learning experience so you can build your skills over time!
That’s it for this blog! If you found it helpful or have suggestions for what you'd like to see next, drop a comment below. I’d love to cover more advanced Streamlit features, SQL optimizations, or other Hive blockchain topics in a future post!
Until next time, happy coding! 🚀🔥
PS: here you can find the example code in case you missed it:
https://github.com/gamerbeaker007/HiveSQL
Thank you for this walkthrough. These posts are great inspiration for me. If only I had 8 more hours in the day to work on my hobby projects!
Regarding AI and coding I finally found something that works for me. I have been somewhat of a luddite on the topic, but so many times I just found that it took me longer to use ChatGPT to code something than to just do it myself. Also, it was often just wrong. I know prompt engineering is a skill, but whatever.
Enter Github Copilot. I know its not new or anything, but I love the autocomplete it provides. This is finally something that saves me time. I use it in VS code but I think it can be used in other IDE's too. Definitely recommend trying it.
Still have to try out Copilot some day... I Got the chatgpt plus from work so love to use it often, now also in personal project not only for work. Great future ahead with AI imho.
I often code roughly wat i need the structure most often already working code, then ask chat gtp for feedback. For stuff that i do not known is ask chatgtp for examples and work from there on..
Oh, when I have some time I will definitely try this out!
Yeah, it think you will manage, seeing what you already doing with setting up a node etc 🤣
Thank you for this post which contains a lot of useful information for those who want to start using python and hivesql
!hiqvote
!discovery 30
@tipu curate
Upvoted 👌 (Mana: 4/44) Liquid rewards.
Upvoted 👌 (Mana: 0/44) Liquid rewards.
Thanks 😁
@libertycrypto27, the HiQ Smart Bot has recognized your request (1/3) and will start the voting trail.
In addition, @beaker007 gets !HUG from @hiq.redaktion.
Discord. And don't forget to vote HiQs fucking Witness! 😻For further questions, check out https://hiq-hive.com or join our
This post was shared and voted inside the discord by the curators team of discovery-it
Join our Community and follow our Curation Trail
Discovery-it is also a Witness, vote for us here
Delegate to us for passive income. Check our 80% fee-back Program