The Hive blockchains has around 2.5M.
What percentage of these accounts are active? How many active accounts the Hive blockchain has and how are they transacting/using on the blockchain?
How is the bear market influencing the number of active accounts?
Let’s take a look!

Top Four Hive Operations
We will be looking at the activity on the chain by the top operations made:
- Post and comment
- Votes/Curate
- Transfer coins
- Custom JSON transactions
Apart from the above, reading, or page views, is also a crucial part of this ecosystem, but this type of operation is not stored on the blockchain.
We will be looking at the number of active accounts by the operations stated above for the 2022 – 2023 period.
We will be looking at the number of DAUs (daily active users), the number of MAUs (monthly active users), and then summary for the whole year.
Daily Number of Active Accounts
First let’s take a look at the number of accounts active per day. Here is the chart.
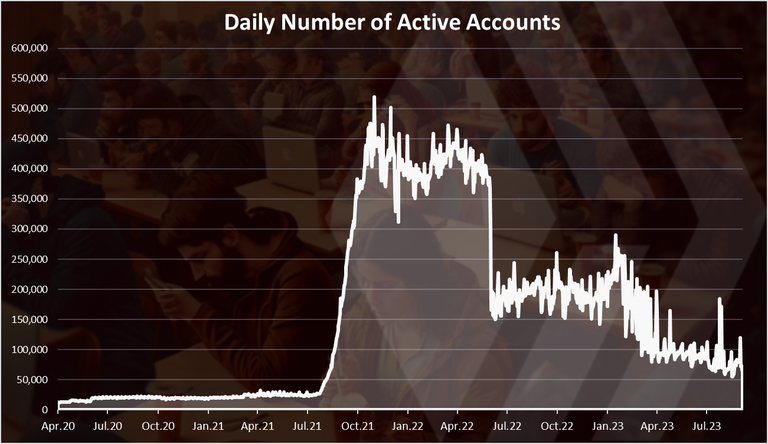
The above is the chart for DAUs, for accounts making any type of operation.
This chart is from the Hive creation fork, back from March 2020. As we can see at first in 2020 the number of DAUs was low with around 15k to 20k accounts making any type of operation on the Hive blockchain daily.
Then in the summer of 2021 this number increased significantly driven by the success of Splinterlands. At one point the DAUS reached 500k per day. In 2022 the DAUs numbers were around 200k, and in 2023 this number continued to goes down and we are now somewhere around 85k DAUs per day.
Most of these movements are due to Splinterlands active players.
Active Accounts by Category
What type of operations are these accounts making?
From previous analysis we know that most of the DAUs are coming from Splinterlands. If we take a look at a chart with active accounts per operation, we got this:
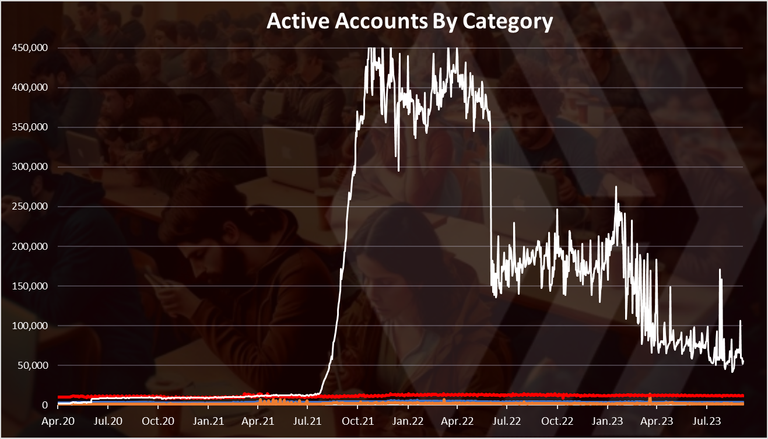
The top line are the accounts making custom JSON operations, that in most cases are Splinterlands operations. The number of these accounts is so much higher then the rest of the operations that we can barely see them on the bottom of the chart.
The number of daily accounts making custom json operations is the last period is around 65k.
If we exclude the accounts making custom json operations for better visibility, we get this:
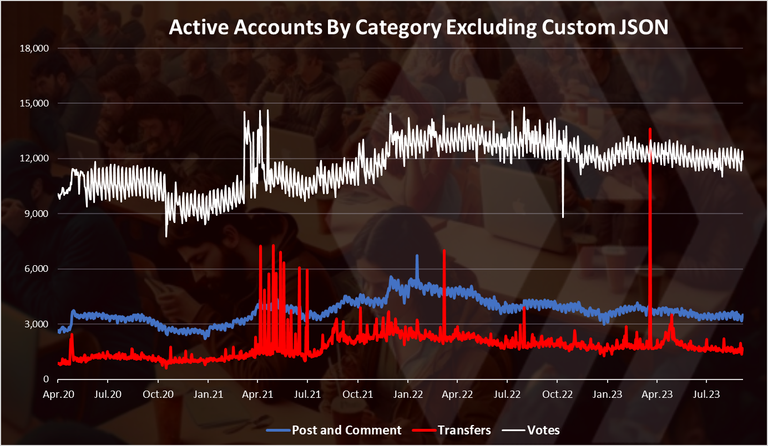
These numbers are quite stable.
From the above we can see that in the last period there is around 12k accounts voting/curation on daily basis, then there is around 3.5k accounts making posts or comments, and around 2k accounts transferring funds.
Its interesting to see tat there has been some spikes in the numbers of active accounts that are transferring HIVE around.
We can notice a slight downtrend in the number of these operations, but no significant drop, compared to the prices.
Active Accounts Posting or Commenting
If we focus only on the core activity so to speak, the chart for accounts making post or comments looks like this:
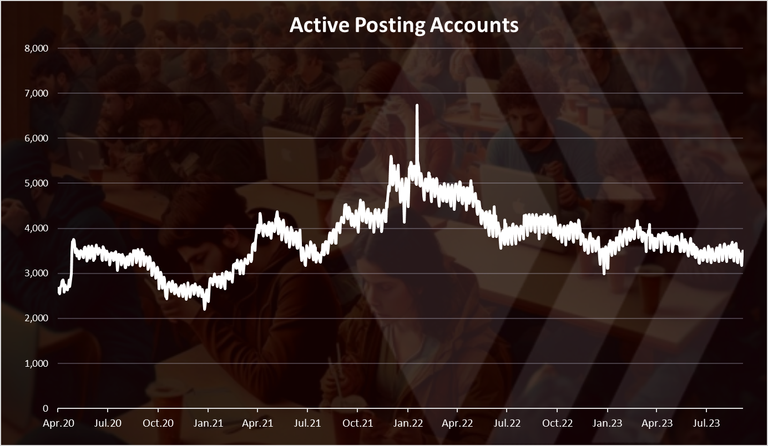
We can notice the uptrend until January 2022, and then a steady downtrend since then. At the top there were around 5.5k accounts making post or comment daily. Now we are at 3.5k DAUs, back around the level where we were in 2020. The drop in the number of posting and commenting accounts is much smaller compared to the overall activity.
Monthly Number of Active Accounts
The monthly numbers might give a better perspective for active accounts, as not all the users are making operations daily. Here is the chart.
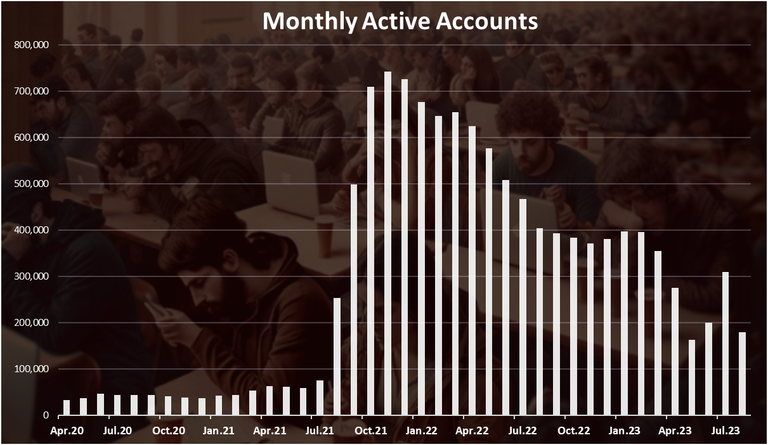
We can see the sharp increase in the MAUs back in 2021. From around 50k to more than 700k in a few months. After the peak at the end of 2021, the number of MAUs has steadily been going down, and we are now at 180k MAUs in August 2023. Note again that most of this movements are due to Splinterlands.
When we breakdown the monthly active accounts by type of operation we get this:

As for the DAUs, we can see that the custom JSON operations dominate this chart as well.
Back in 2021 there were 700k accounts making custom json operations while now we are at 150k MAUs.
If we zoom in for the other three categories, excluding the custom_json , we get this:

A much steadier numbers here, with a slow growth towards January 2022, and then a slow decline. The number of accounts voting is on the top in terms of MAUs, with 18k in the last month, followed by the accounts transferring funds, with 12k, and then closely next are the MAUs for accounts posting or commenting with 10.5k.
Active Hive Accounts by Category in August 2023
For the month of August 2023, the number of MAUs, summarized by categories looks like this.
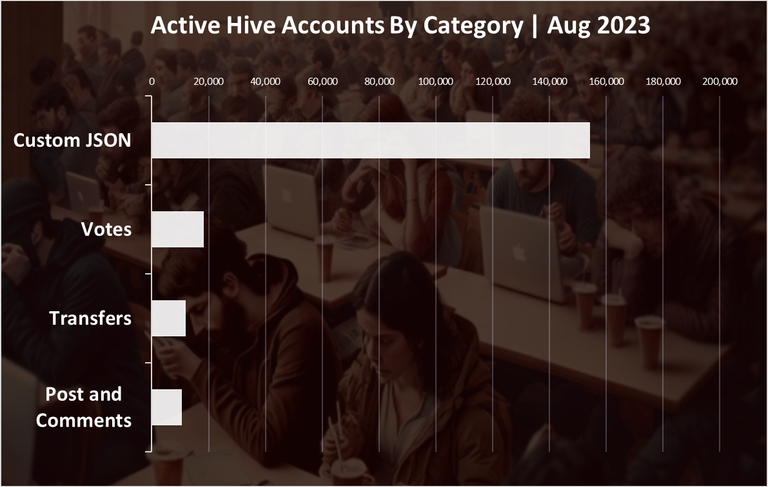
Number of active accounts in 2023 by operation:
- Custom JSON - 154k
- Votes – 18k
- Transfers – 12k
- Post and Comments – 11K
In total there is 180k accounts making some type of operation in August 2023 on the Hive blockchain.
What’s interesting is the number of accounts transferring coins is on the second spot here. Curation/votes are next and posting comes at the end.
Overall, we can see that the gaming side of the Hive blockchain has been led by Splinterlands and has taken over the number of DAUs and MAUs, but the numbers have been volatile. The number of accounts posting, commenting, voting has been much steadier in the last three years, with a slow increase during the bull and a slow decline since then.
All the best
@dalz
The chart shows that the Hive user base in 2021 was remarkable. But that period seems to have been too much for the bull market. Although currently the number of daily users is decreasing but hopefully the number of users will increase again very soon.
Definitely, the blogging side of Hive is very low in comparison to Splinterlands.
Low, but resilient :)
I had no idea there were that many accounts created due to Splinterlands, that spike is insane. Great to see the breakdown of how the rest of the ecosystem fairs in comparison as well. I enjoy these stats posts of yours, always got great data.
Hey Dalz, I come back to these reports all the time to get some clarity on the amount of users and transactions on the HIVE blockchain. Looking forward to your next report.
Huge thanks!
Hive continue to impress
Thanks for the great overview Dalz. May I ask are you pulling the data from Hive SQL?
Yes
Awesome to know about all this.
The chain remains stagnant with a slight decrease in users. The bear market is being tough.
Good to know about it.
Thank you for this information. I think it will be valuable to follow this in the next bull run. 😀Amazing @dalz
!ALIVE
You Are Alive so I just staked 0.1 $ALIVE to your account on behalf of @ tuisada. (6/10)@dalz!
The tip has been paid for by the We Are Alive Tribe
 through the earnings on @alive.chat, feel free to swing by our daily chat any time you want, plus you can win Hive Power (2x 50 HP) and Alive Power (2x 500 AP) delegations (4 weeks), and Ecency Points (4x 50 EP), in our chat every day.
The Hive.Pizza team manually curated this post.
You can now send $PIZZA tips in Discord via tip.cc!
I'm actually not happy that the number of accounts that are active has reduced but we that are still active here should try to be more active and it can motivate others to be active too
How about that?
Congratulations @dalz! You have completed the following achievement on the Hive blockchain And have been rewarded with New badge(s)
Your next payout target is 50000 HP.
The unit is Hive Power equivalent because post and comment rewards can be split into HP and HBD
You can view your badges on your board and compare yourself to others in the Ranking
If you no longer want to receive notifications, reply to this comment with the word
STOPTo support your work, I also upvoted your post!
Check out our last posts:
It's like everywhere when the market goes down people completely stop using things but that's their biggest mistake here is the time to work hard and get success thank you so much for being with us. Kind of keep sharing very special things.
It’s only natural for people to get tired of the bear market, hopefully they get their Hive spirit back and come back.
Good job mate!
It would be interesting to see a more complete picture here that includes the history of Steem too and also how Steem has continued after the creation of Hive. This would allow meaningful comparisons to be made in order to dissect the causes of any observable patterns that affect growth and behaviour.
I can go back to 2016 and get the data from there, but not for steem only after March 2020 ... for sure the numbers are lower there now, I bet under 1k MAUs
I'm not sure if I understood you there. Isn't the data between 2016 and the Hive era all Steem data?
Yes, the period between 2016 and 2020 is accesible on HiveSQL. The period after March 2020, for steem only is not
Ah right ok, I figured it was possible to access that data from a Steem source of some kind, but I haven't been following Steem at all since Hive was created, so I don't know what it might be.
Users look to lose interest in Hive.
And I guess it's probably because of reasons like:
Users look to lose interest in Hive.
And I guess it's probably because of reasons like:
Why get more involved with self-appointed watch dogs can downvote your posts into oblivion? We had a nice thing going for awhile, but it's been destroyed because of the thugs.