How did Hive do in February 2025 from an inflation standpoint? Let’s take a look!
The projected inflation for Hive for 2025 is 5.5% on a yearly basis, or around 0.45% on a monthly basis.
Hive has a double currency system, HIVE and HBD, with conversions between them that add or remove HIVE from circulation on top of the regular inflation. Furthermore, the decentralized hive fund DHF, that serves as a DAO converts the HIVE that is in the DHF into HBD.
Because of this additional mechanics the HIVE inflation and supply can be drastically different in real time than the regular/projected one.
The @hbdstabilizer has also grown and it is playing an important role in the overall tokenomics, making conversions and trading on the internal market.
To be able to follow the HIVE supply we need to take a look at all the different ways HIVE is created, author, curation, witness rewards, conversions etc, then net that out with the HIVE burned from conversions, accounts fees, null transfers etc. To get the virtual supply we need to do the same for the HBD supply as well.
HIVE Created
Here is the chart.
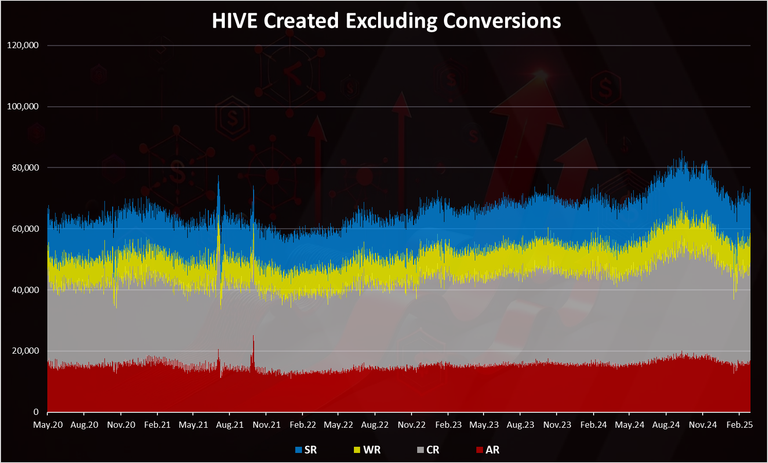
The chart above includes:
- Author rewards
- Curation rewards
- Witness rewards
- Staking rewards
These are the regular ways new Hive enters circulation, and all of them are through vested HIVE, aka powered up. The regular inflation is around 70k HIVE per day.
We can notice the increase in the daily HIVE issued because it is dependent on the virtual hive supply, or the base for inflation. When the price of HIVE is low, the virtual hive supply increases, and when it is up, the virtual hive supply decreases. After a period of growth, especially in the summer of 2024 we are now down again.
The thing is the conversions are playing a major role in the ecosystem. Here is the chart again, including conversions.
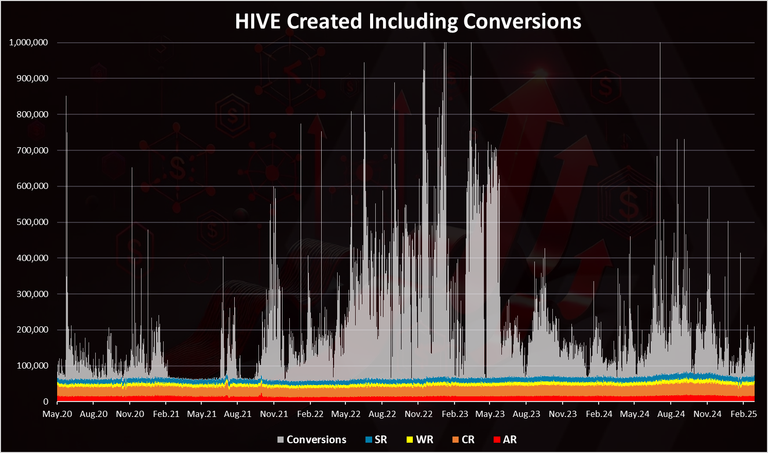
We can notice that the HBD to HIVE conversions are the dominant in the chart. This works in both ways and a big part of them is converted back to HIVE, especially through the work of the stabilizer.
We can notice the spikes in recent months because of the drop in the price of HIVE and some users have taken advantage of this and converting HIVE to HBD.
HIVE Removed from Circulation
Here is the chart.
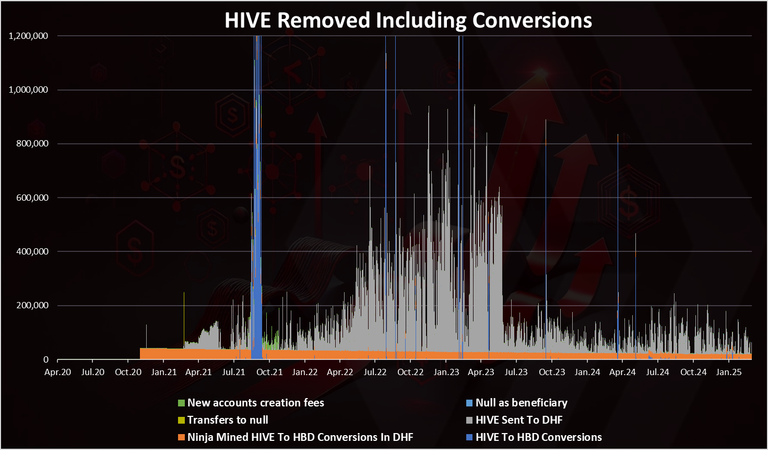
The above takes into consideration six different ways of HIVE removed:
- Ninja Mined HIVE To HBD Conversions In DHF
- HIVE transfers to DHF and converted to HBD
- Transfers to null
- Null as post beneficiary
- New accounts creation fee
- HIVE to HBD conversions
The HIVE transfers to the DHF are now dominant. These are transfers made by the stabilizer. We can see a few spikes in the HIVE to HBD conversions (blue), with one occurring just recently. These were due to the increase in the HBD price. We can also notice the drop in recent months, same as the opposite conversions due to the low volumes that the stabilizer is doing.
Historical HIVE Supply
When all the above is added and removed, we get this chart for the all-time HIVE supply.
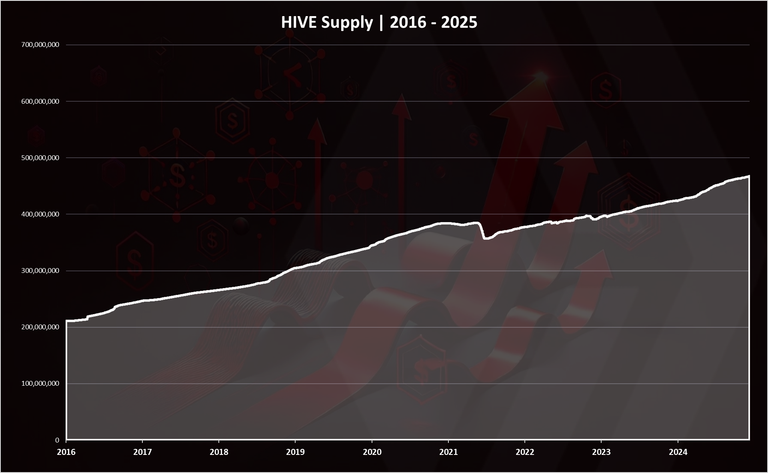
Up until August 2021, the supply was almost steadily increasing with a small fluctuation. Then a drop in the supply in September 2021. Since then, from time to time we can see some drops in the supply in February and April 2023.
February 2025 ended with 467M HIVE in circulation.
HBD Supply
Here is the chart for the HBD supply.
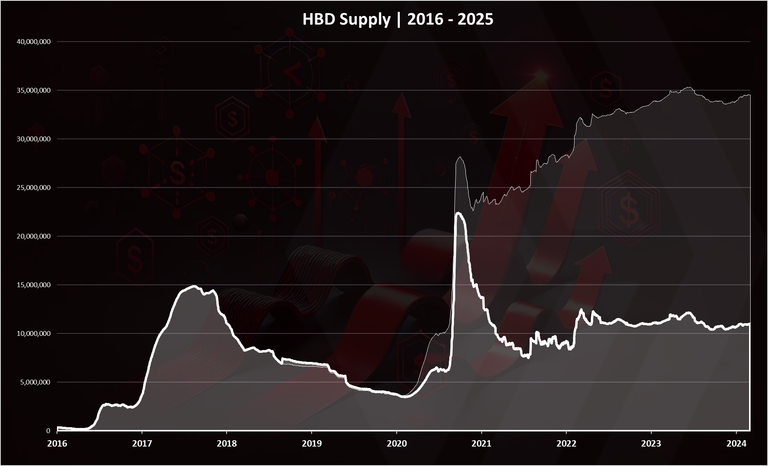
The light color is HBD in the DHF. The HBD in the DHF is not freely circulating HBD and only enters circulation when payouts to the DHF workers are made.
HBD is being created and removed in various ways, but the conversions play the major role here in both directions. Other ways HBD is created are DHF proposal payouts, author rewards and interest.
We can see that after a downtrend in 2022, in the last period the HBD supply is very stable around the 11M.
In the last month the HBD supply has been very stable around the 11M with almost no change.
Virtual HIVE Supply
When we add the HIVE equivalent supply from the HBD to the HIVE supply we get the chart below.
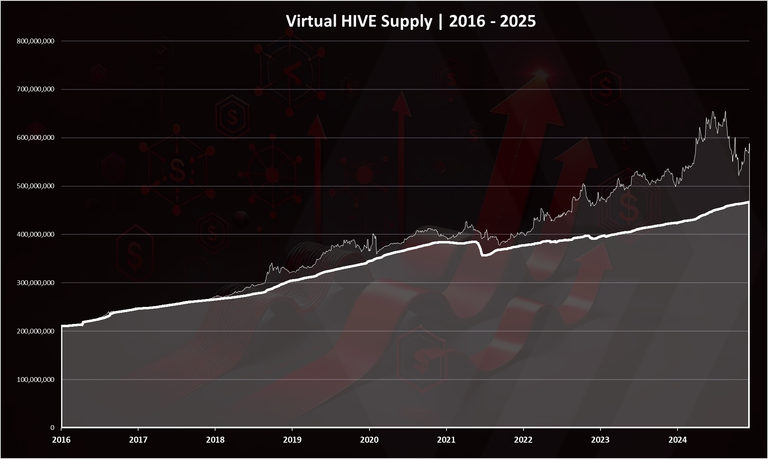
The light color is HIVE that in theory can be converted from HBD at the current market prices for HIVE.
We can see that the virtual supply fluctuates a lot, mostly because it is tied to the price of HIVE. As the price of HIVE drops, the virtual supply increases and the opposite.
We can notice that after the sharp increase in the virtual supply there is now a pullback in the last months.
When we zoom in 2023 - 2025 we get this:
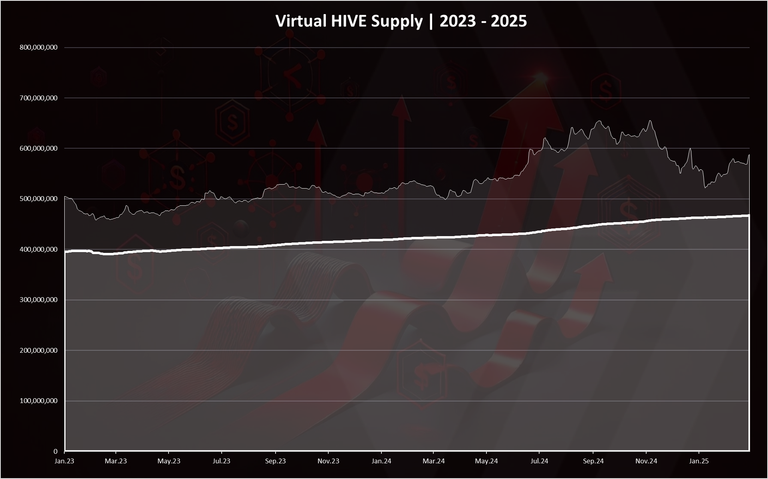
Here again we can see the increase in the virtual supply towards the end of the chart. The regular HIVE supply has slowly increased in the period.
Projected VS Realized HIVE Inflation in 2024 - 2025
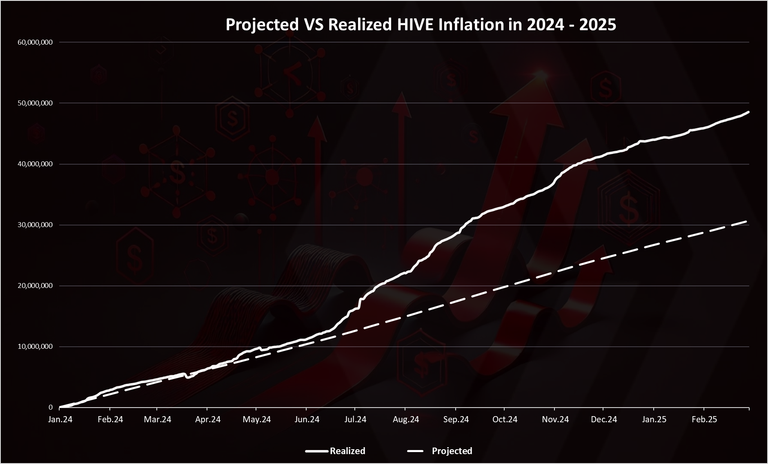
This chart tells the story of the new HIVE entering circulation in 2024 – 2025.
We can see that in the first half of 2024 the realized inflation followed the projected one closely, but in the summer of 2024 the realized data started increasing more mostly due to negative market conditions. In the last months and in the beginning of 2025 the realized inflation is back at the same rate as the projected one.
Monthly Inflation
If we plot the monthly inflation in 2021-2024, we get this.
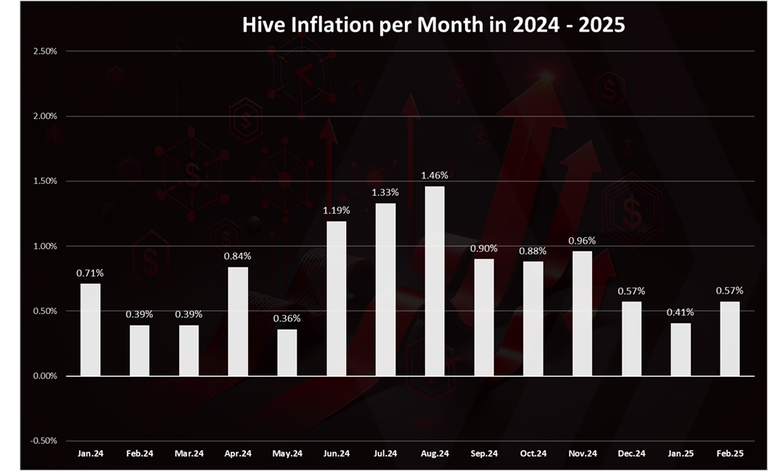
This is a chart for the period of 2024-2025.
As we can see all the months in the period are positive. May 2024 is the lowest one with 0.36%, while August is the highest with 1.46%. In the last months we have moderate numbers around the 0.5% mark.
February 2025 is just around the projected one with 0.57%.
In terms of absolute numbers, the HIVE supply in February 2025 has increased from 465M to 467.7M, adding 2.7M HIVE in circulation, while the projected one is around 2M.
Yearly Inflation [%]
The yearly, projected and realized inflation looks like this.
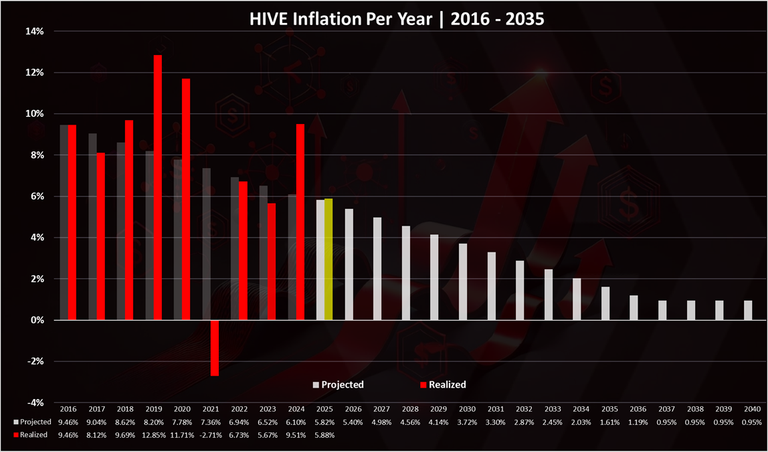
After the inflationary 2024 with 9.5% realized inflation, the first two months of 2025 are somewhere back to normal with just about the projected inflation.
But we are still very early in this year with two months behind us. Last year the first half was also somewhat neutral, but then the second half ended being more inflationary. Will see how things will evolve in 2025. Also to note that the regular inflation is constantly dropping with around 5.5% now.
Net HIVE Created by Category in February 2025
Here is the new HIVE put in circulation by category for the month.
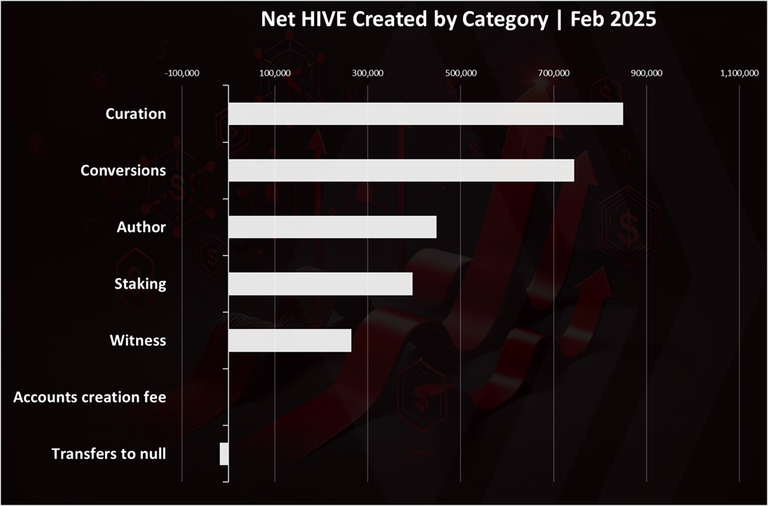
Conversions are positive with 720k HIVE created in this way. Conversions are the main variable that is changing the Hive inflation and when they are positive the inflation is above, or when they are negative the inflation is below the projected one.
The curation rewards are in the first spot with 880k HIVE.
Some HIVE was burned for @null as beneficiary and account creation fees.
Note that authors rewards are paid 50% HIVE, 50% HBD, and the HIVE share only is at 500k, while approximately the same amount was paid in HBD equivalent. 450k
All the best
@dalz
I did vice versa. I converted almost 150 HBD to HIVE and powered up, I think to do it again if the price of HIVE stays at these level, $0.28-$0.29-$0.30
strange no big increase in hbd when hive pumped to 0,60$
Some great charting as usual! it's interesting to see info on HBD especially.
💪😎👊
❤️
!BBH