What is the time when Hivers post and vote/curate the most? Which days of the week? What hour of the day?
Let’s take a look at the latest data from December 2024.

Having in mind Hive is a global community posting and voting time can vary a lot. Different time zones etc. Can users optimize their posting time, so they get some more attention?
Here we will be running the data for posting and voting time in parallel, so users can compare them. We will be looking at the hours, and at the days of the week, and combine them for a heat map.
We will be analyzing a five-week period, November 25 to December 22, 2024.
The time is in UTC. You can compare it with your local time zone here: https://time.is/UTC
Hours
First the hours. Let’s take a look what time of the day Hivers post and vote the most in the period.
Note again on the UTC time.
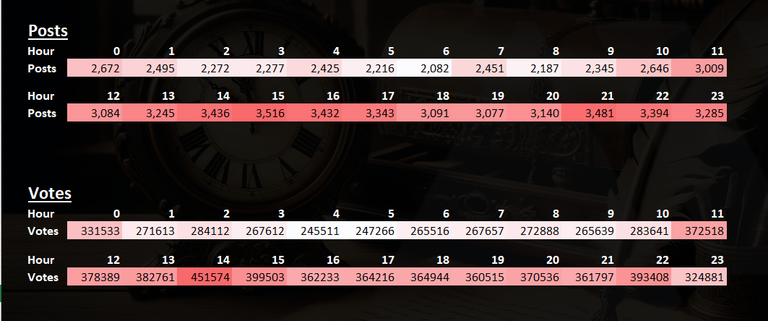
On the posting side we can see that there is a clear trend, where there is more posting between 13h to 17h UTC, with a peak somewhere around 15h and a second peak around 21h. Overall, there is more posting in the 12h to 22h period.
Between 5 and 8, there is the lowest number of posts. The drop from the peak hour (22h) to the low hour (8).
On the voting/curating side there is a slightly different pattern. The peak is a bit earlier in 14h, continued with a high numbers up to 22h, after which it drops in the hours afterwards with a low in 4h.
There is a second peak in 22h.
The data above is a sum of all the posts in the hours for the analyzed period.
Days of the Week
Now that we have seen the hours data, lets take a look at the days of the week. What days of the week Hivers post and vote the most?
What days of the week Hivers post and vote the most?
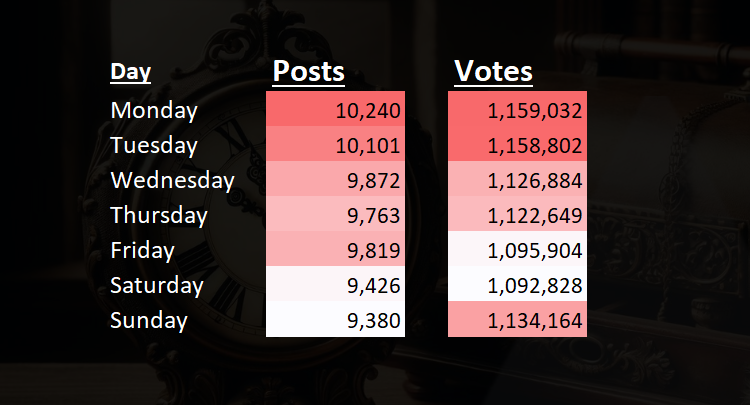
A clear trend on the posts here. Monday and Tuesday are the days with the highest numbers of posts, while the weekend not as much with Sunday being the lowest. Although the drop in the number of posts is not that big. From 9k to 10k. Around 10% difference.
The voting shows a bit of a different pattern, with Saturday having the least voting activity, while Sunday is quite active, almost at the level as for the working days. The peak is at the beginning of the week, Monday and Tuesday having the highest numbers.
Maybe hivers want just to read and curate on Sunday.
Heatmap
Combing the days and hours and we get the heat map.
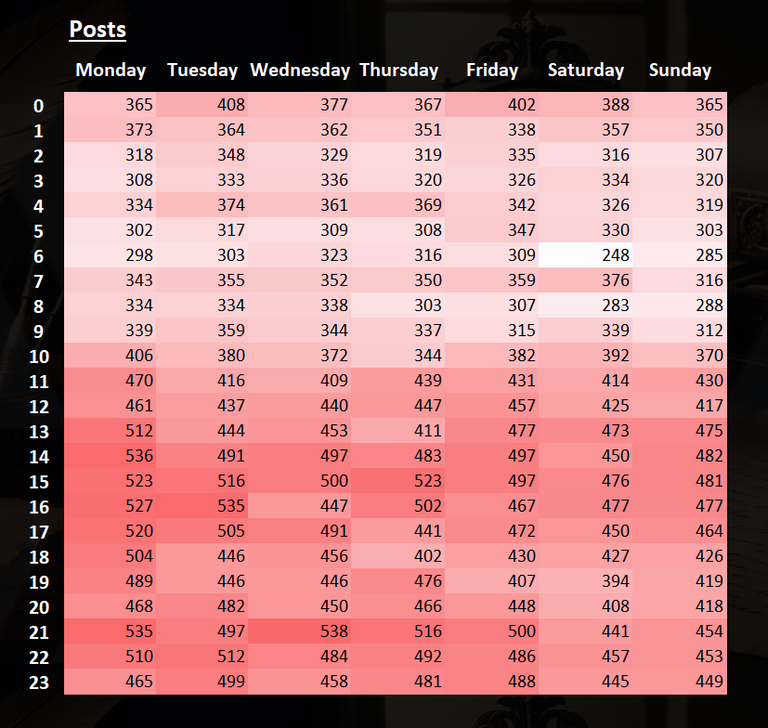
First the posts:
We can see that the start of the week between 12h and 22h is quite busy. This period seems to be divided into two waves, first with a peak around 15h, a slowdown in around 21h and again a second peak around 22h. Going towards the weekend the numbers get lower.
The quite hours are between 4h and 8h.
On a 2D surface chart the same data looks like this:
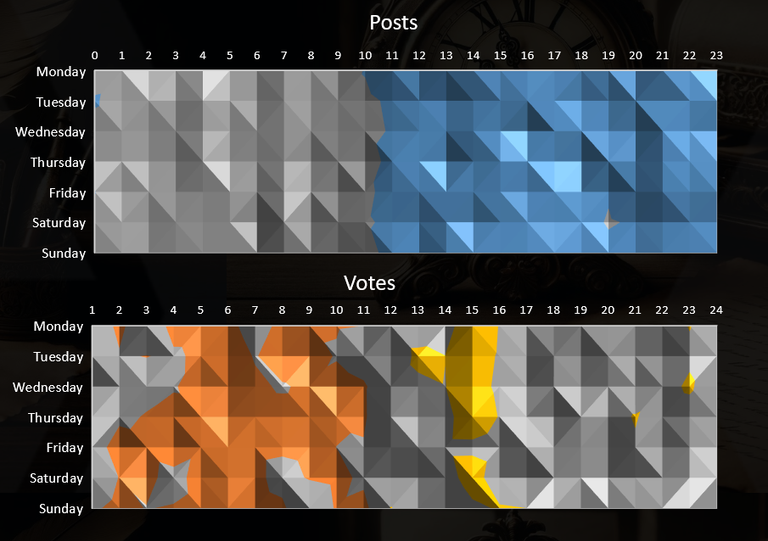
The gray is with lower activity, blue with higher activity. two zones from here from 11h to 23, and from 0 to 10. Although as we have seen from the previous chart the differences are more subtle then this.
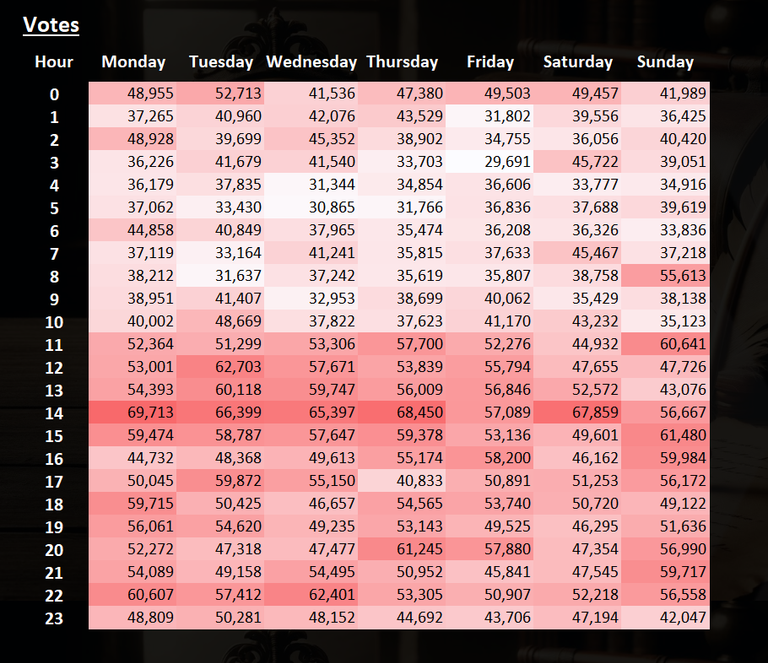
The votes heatmap** looks like this.
Again, voting seems more random than posting. Some spikes happening randomly between hours and days. Although there is more activity in the period as for the posts, that is 13h to 22h. Again, Sunday looks busier for voting than Saturday. Between 4h and 8h is obviously quieter for voting as well.
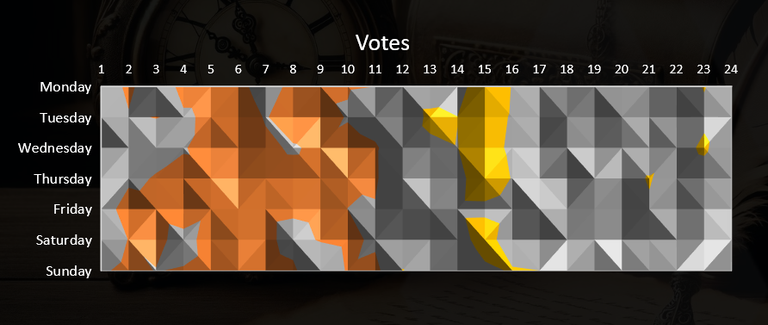
On a 2D surface chart the voting data looks like this:
Three zones here. The gray represents somewhat of a middle ground, the orange the lows and yellow the peak. Around 15h is usually the peak especially in the working days, while the lows in the period of 4h to 9h.
Put together the two charts look like this:
All the best
@dalz
Interesting data! I've run an experiment on the best time to post in Hive where I could possibly get the most viewership and ultimately, votes, and it's more or less the same as the data presented in this post! So cool!
Tnx!
Most challenges and contests run on Mondays and Tuesdays or Monday through Friday. When these challenges are ongoing curators have to vote so many entries.
Thanks for the data.
You welcome!
I am sure much of the voting time is scheduled and performed automatically by voting bots. But that is interesting to see when is the best time for posting vs when the curation happens. Thanks for the numbers!
Did not expect weekends to have lower number of post since most would likely have to work on weekdays and since I made most of my recent post during weekends the past few months.
Its something that could prove valuable. Thanks :)
Wow. This one's interesting. I randomly thought saturdays and sundays is when people post the most. Unfortunately, not. Haha
I'm not a numbers guy but this is amazing so ty. I don't watch when to post or what time to post. I do it when I feel like it engaging with other people inside Hive is the real value imo.
Thanks for the data. Users have more free days on Saturdays and Sundays. So I would have expected more posts on these days. Interestingly, there are more posts on Mondays and Tuesdays.
Voters vote more at 14:00 UTC daily. And they vote more on Mondays. This information will be useful to me.
@tipu curate
Upvoted 👌 (Mana: 8/48) Liquid rewards.
I think the weekends are when people are mostly away with their familys or doing something different. So they're back on Monday and Tuesday fully rejuvenated to create on the chain.
Really grateful you put together this info, and in such a visually representative way! Looks like you accidentally put in the votes surface graph where you meant to put the posts one; the first surface graph of the chart.