Bitcoin has seen a lot of activities around L2 in the last year. Ordinals, inscriptions, new token standards, EVM compatible projects etc. All of this caused an increase in the number of transactions and activity on chain that increased the fees as well.
While the hype has went down a bit in the last months, these things wont be undone. They are now there and exploring all the options that the Bitcoin protocol provides for storing arbitrary data.
It is sufficient to say that tokens, NFTs on Bitcoin have caused a lot of controversy as the Bitcoin purists are not a fun of them.
With this said let’s take a look at the Bitcoin network data, and how have these Bitcoin NFTs impacted the network.
We will be looking at:
- Supply
- Active wallets
- Hash rate
- Number of transactions
- Fees
- Miners revenue
The data presented here is mostly gathered from the blockchains charts.
Supply
The one thing Bitcoin is well known for. Its limited supply. There will ever be only 21M coins. Here is the chart with the current supply.
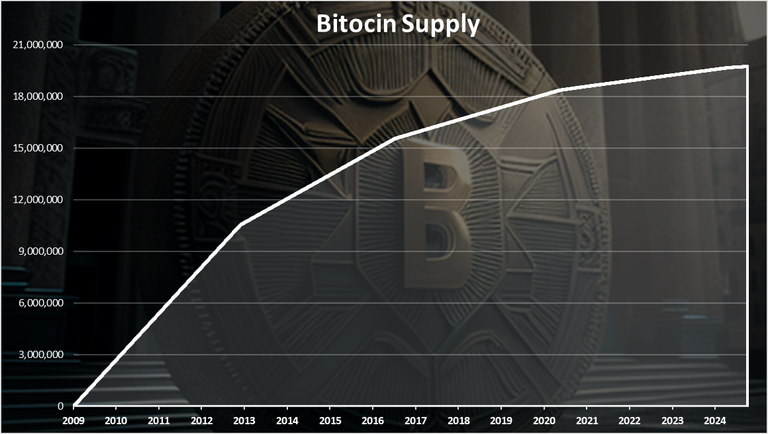
We can notice the breaking points on the chart. This is usually when the halving happens and the emission rate on Bitcoin is reduced.
The past halving events and the block reward reduction goes like this:
- November 21, 2012 from 50 to 25 BTC per block,
- July 9, 2016 from 25 to 12.5 BTC per block,
- May 11, 2020 from 12.5 to 6.25 BTC per block,
- April 19, 2024 from 6.25 to 3.125 BTC per block.
Four past halvings with the latest one recently in April 2024.
At the moment the Bitcoin supply is at 19.76M or almost 94% of the supply is mined.
Active wallets
How many wallets are active per day on the Bitcoin network?
Here is the chart.
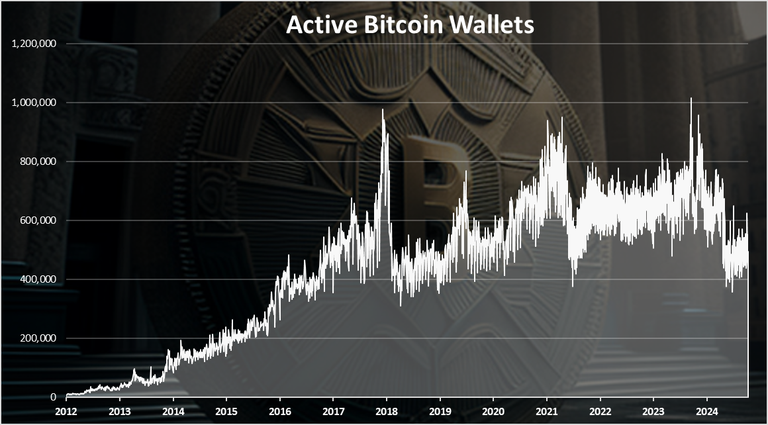
The record high numbers for active Bitcoin wallets per day was reached in September 2023 when the hype around inscriptions happened. There was just above 1M wallets for one day. Previously a long standing record was achieved back from December 2017.
When we zoom in 2023 - 2024 we get this:
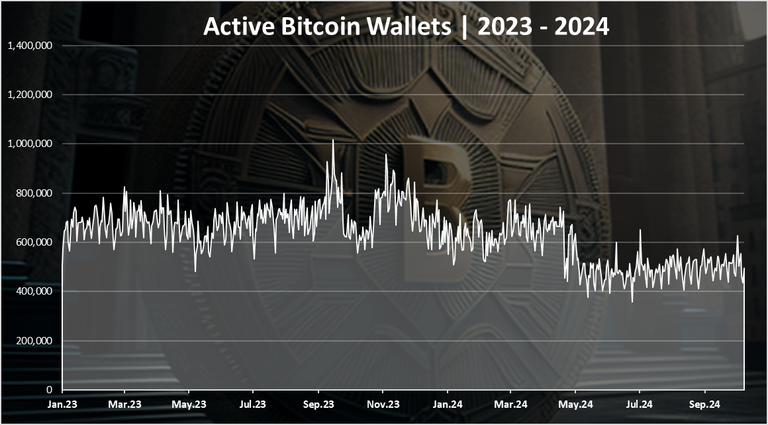
At first a steady number with around 700k active wallets, and then a drop in the summer of 2024 to around 500k where we are now.
Since the summer of 2024 there has been a drop in the activity, but it has slowly increased again.
Transactions
The activity on the network is mostly represented by the number of daily transactions.
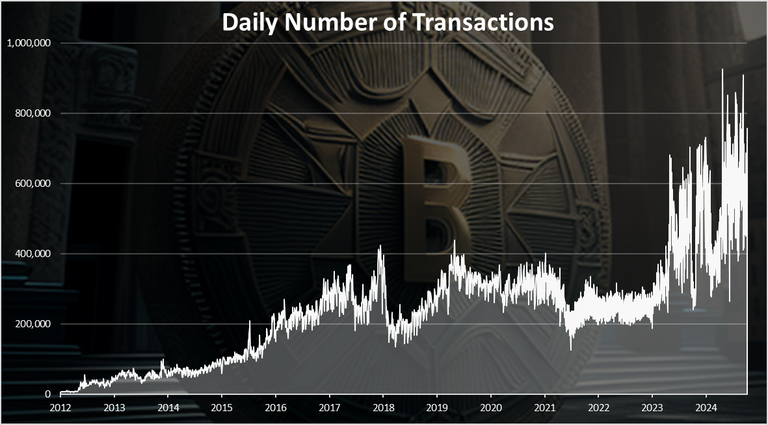
This is where most of the change in activity is visible on the bitcoin network.
A spike in the number of transactions from under 300k per day to 800k per day in 2024. A new ATH for the number of transactions.
This chart is the most telling about the impact that the Bitcoin NFTs have on the network.
We can see that the increase in the number of transactions reached a peak in May 2023. A sharp drop in October 2023 to 300k and recovery again to 700k transactions per day, a drop again in February 2024 and a recent spike to 800k. In the last days the number of transactions on the network is around 600k.
Hash Rate
The ultimate Bitcoin value is the network stability and security. The network security in a proof of work chains is measured in hash rate, or how difficult is to mine. The bigger the completion, the higher the hash rate.
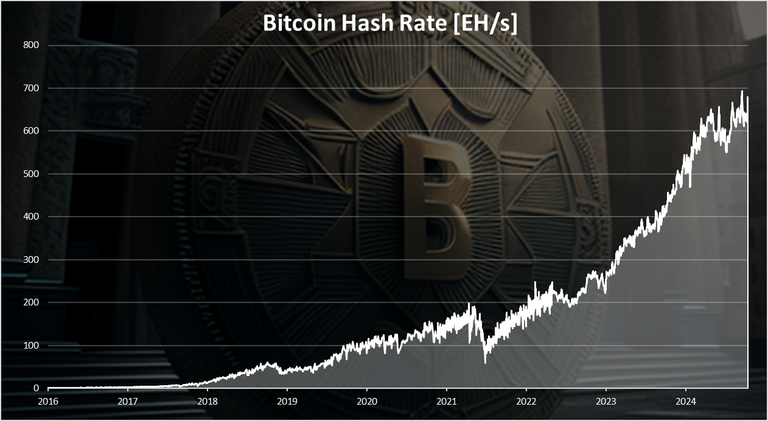
Almost constantly going up with few dips here and there. The most significant dip happened in the summer of 2021 when China banned mining. We can see yet another one just happened recently at the end of 2022, but recovered since then and continue to grow massive to another ATH for the hash rate.
A small dip again and after the halving in 2024, but a very fast recovery since then.
We are now at almost 700M TH/s and growing. Some are now using the EXA unit, 700 EXA Hash per second.
Fees
A bit unpopular topic the fees.
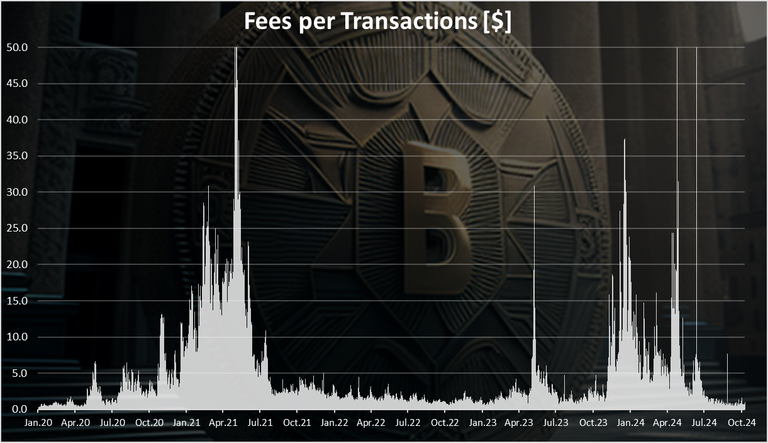
A two visible spikes in the chart starting from 2020 till today.
First back in 2021 during the bull market the fees spiked to 50 USD per transaction in April 2021. Then they dropped to a few dollars per transaction during the bear market in 2022. A recent spike again in 2023 caused by the second layer development on BTC. A peak towards the end of 2023 to a $35 per transaction, still lower than the previous bull market.
In the last period the fees have dropped again to under a dollar per transaction.
Note that unlike the smart contract chains like Ethereum and all the others, that have different type of transactions, like transferring ETH, transferring other tokens like USDT, executing smart contract action like Uniswap trade, etc. Bitcoin has only one type of transaction and that one is expensive now.
Miners Revenue
Miners are receiving incentives from inflation, or the bitcoin miners rewards per block, but also from the fees users are paying to execute transactions. Whenever there is a bigger demand for transactions the fees increase and therefore the miners reward as well. Here is the chart.
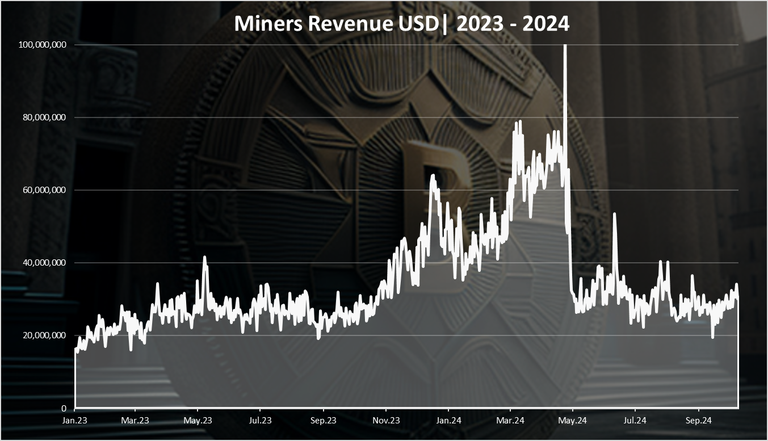
We can clearly see the effect of the halving here. An increase in the miners revenue up to April 2024 to a record high of 80M USD per day, and then a shar drop to around 30M USD per day. This is more or less on the same level as the beginning of 2023.
Hash Rate VS Price
When we plot these two together, we get this.
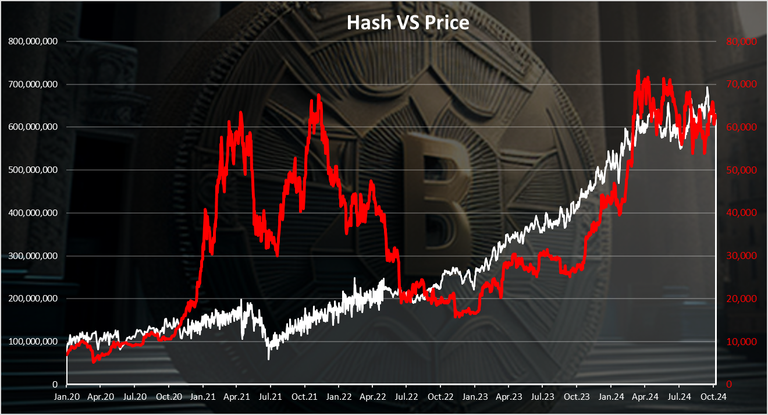
Unlike the price the hash rate has been constantly growing. Although we can notice an obvious correlation, especially back in 2021, when the price increased, shortly after so did the hash rate, but at a lower rate.
At the end the chart for the Bitcoin yearly candles on logarithmic scale:
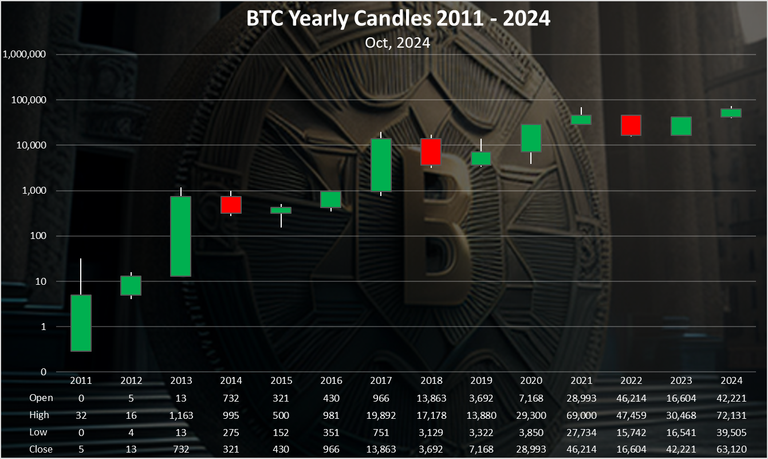
Three green ones, one red 😊. 2023 had a green candle with a start of 16k and end somewhere above 40k. Almost inverse of the previous year 2022, that was a red one. 2024 is still early but for now it is a green candle as well.
All the best
@dalz
Looking forward for the 3rd green candle!
Hope its much bigger at the end of the year :)
@tipu curate
Upvoted 👌 (Mana: 25/45) Liquid rewards.