Greetings Crypto Enthusiasts,
Many people have been wondering when exactly it is we can expect an upward trend to follow the Bitcoin halving event that occurred on March 12th 2020.
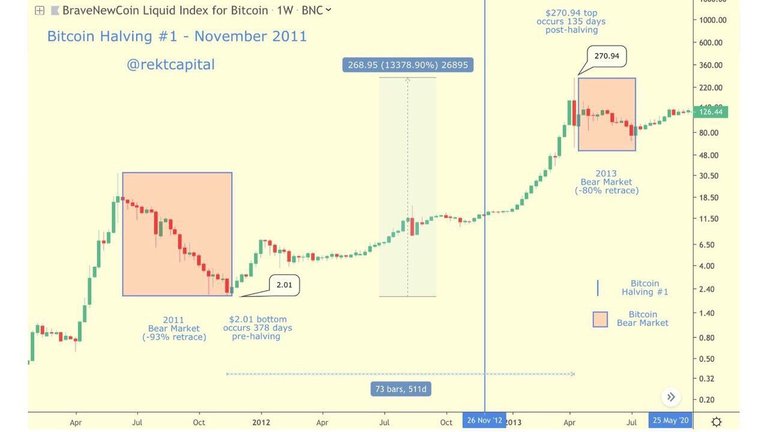
Although I don’t have a date and time to offer up, there is data that is available which we can use to extrapolate a reasonable time period provided that the craziness of 2020 doesn’t too adversely impact the Bitcoin market. Let’s examine the first Bitcoin halving in the chart below to see what history tells us.
 (Source: Twitter @rektcapital)
The highlight on the chart marks the halving date which is displayed as Nov 26th 2012. From this highlight to the peak of the upswing elapses 135 days. But from the halving to the beginning of the upward trend takes roughly 40 days.
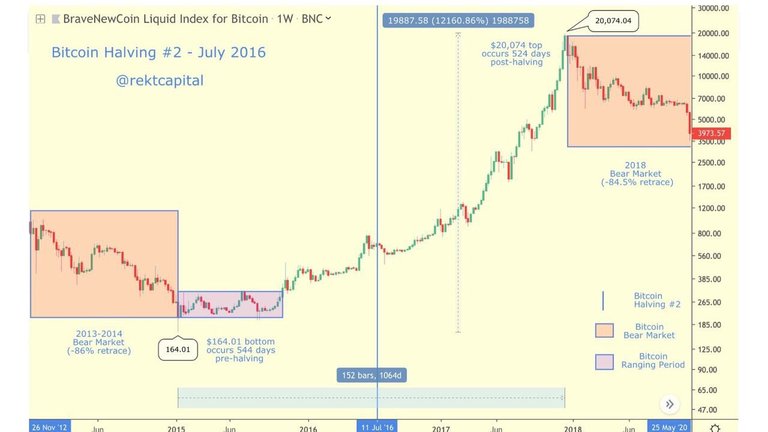
 (Source: Twitter @rektcapital)
In the second chart from the time of the halving to the peak of the upswing elapses 524 days. This time around the period took almost four times as long. From the time of the halving to the the beginning of the upward trend in this chart takes roughly 60 days. That’s still twice as long as the first halving.
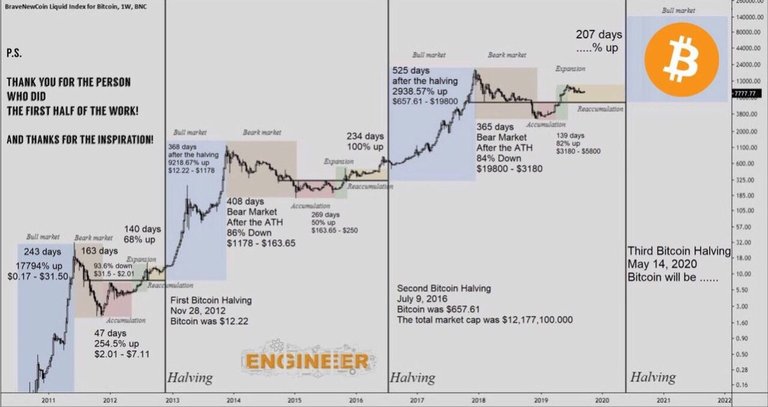
 (Source: @marco93104155)
If the market follows the historical trend of the previous halving, and if the period of time that elapses between the halving and the upward trend only doubles, we can expect roughly around 120 days from the time of the halving before we can see BTC stuck in the green.
This is the timeline that I believe will most reasonably manifest due to the added complexity of the Bitcoin market that we see increasing with the passage of time in comparison to the previous halving events.
If you have any problems viewing the pictures feel free to download them, I uploaded all full size images.
-Kush Freeman