
The week candle is trying to create a top wick right now, touching the 3,000.00 resistance once more, now it totally depends on whether the price can push past the previous ATH to create a new high. If the price is to drop and clear buy volume, it'll pullback before touching the all time high wick because there'll be sellers waiting to sell and sell limits at that price point. So it wouldn't allow sell volumes into the market if it wants to clear buy volume from the market first, only when it wants to break above would it allow sell volumes to accumulate.

The markings that I've made shows the spot where the price needs to be cleared and to also clear buy volumes either from follow buying or buyers buying at each support the price will cross when crashing down.
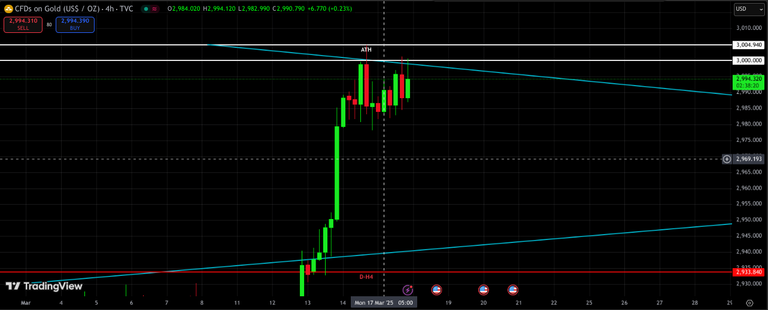
Right now the price is consolidating waiting for the price to press down and clear buy volumes because volumes haven't been cleared. When price start consolidating after a strong breakout, that consolidation is actually waiting to either break above to continue on its trend, or break below to clear buy volumes and attract sell volumes before creating another reversal and pushing the price back up to continue on its trend again. The problem is, how do we know whether the price will break below first or directly break above and continue the trend. The point is to check whether every candle has cleared all wicks on its way up, if it has cleared every wick on almost every timeframe, means it will most likely break above and continue the trend. But if there is either a timeframe which hasn't been cleared, means there's still a chance the price will press down first and clear that gap before pushing up again.
Sometimes if the price hasn't cleared in higher time-frames, you should double check in a lower time-frame to be sure that price really hasn't cleared, it is a trap for those who don't know how to analyze multiple time-frames, sometimes seeing that fair value gap and waiting for enter at that spot and stop loss sweep instead of profiting from it.