I recently started taking online courses through the University of California, Berkeley for Bitcoin and Cryptocurrencies. My goal is to become a CBP (Certified Bitcoin Professional) by this fall. I have been involved with Bitcoin and trading cryptocurrencies since April 2017. I have experienced my fair share of highs and lows throughout this journey. My opinion is the crypto markets will recover and gain strength as we near the halving. Nothing about Bitcoin, the regulations, or the technology changed in any sort of negative way to cause the massive drop like we all saw. It was the COVID-19 scare and reaction from other markets that caused the selling and slight panic. Going from here I do see a lot of upside and positive indicators pointing at a return to normal (whatever normal is). The higher lows we have been making week after week is always a good sign of strength for me. There will be a selling opportunity for some who managed to buy the dip at $3,900- $5,000 as they will be seeing profits of 40-60%. As you can see in the graph, a price drop to $6,800 would keep the upward trend in contact. Fingers crossed!
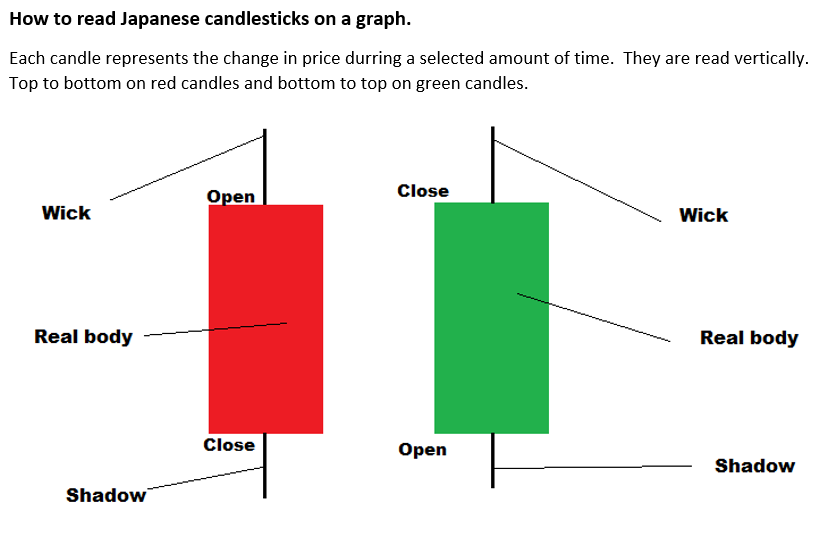
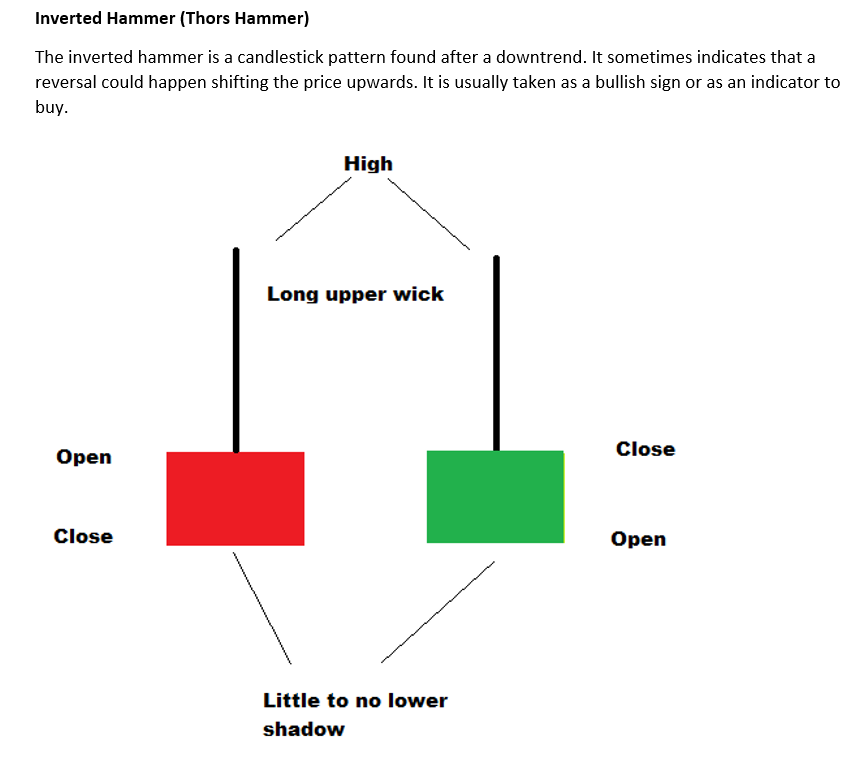
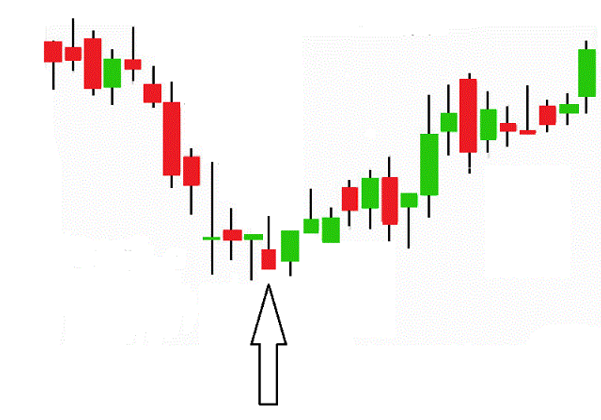
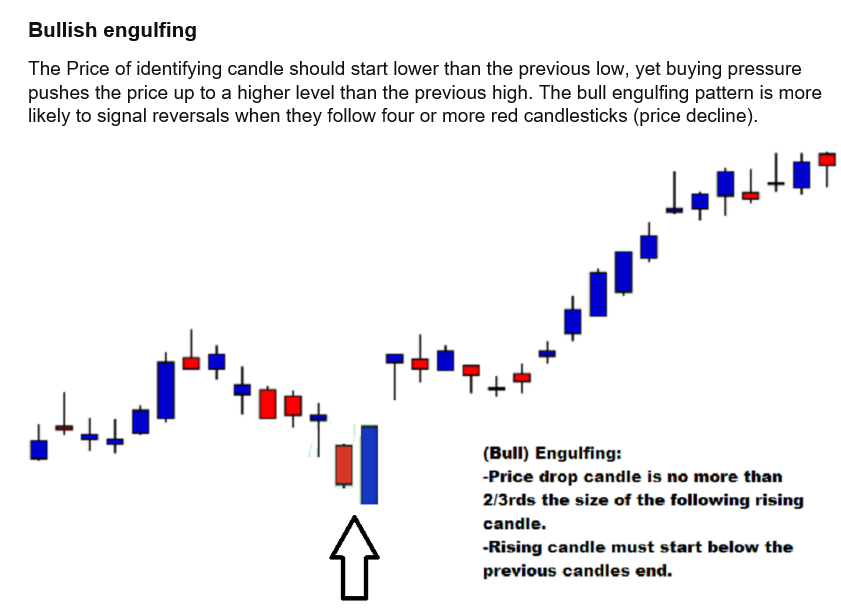
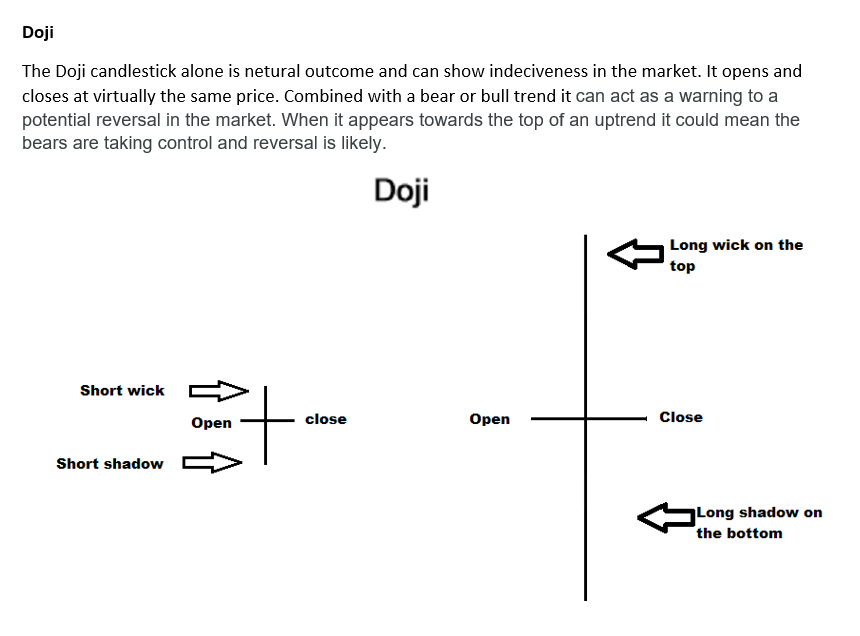
I am also including a few pictures with notes on indicators and candlesticks. I try to look for these while I trade, they have helped me a ton. I made the candlesticks and and pictures using Windows Paint, I think they turned out pretty good.
Any comments or questions would be appreciated, and I would love to hear what you think. This is my only my second TA post ever, and it is kind of nerve racking to be honest.
:)
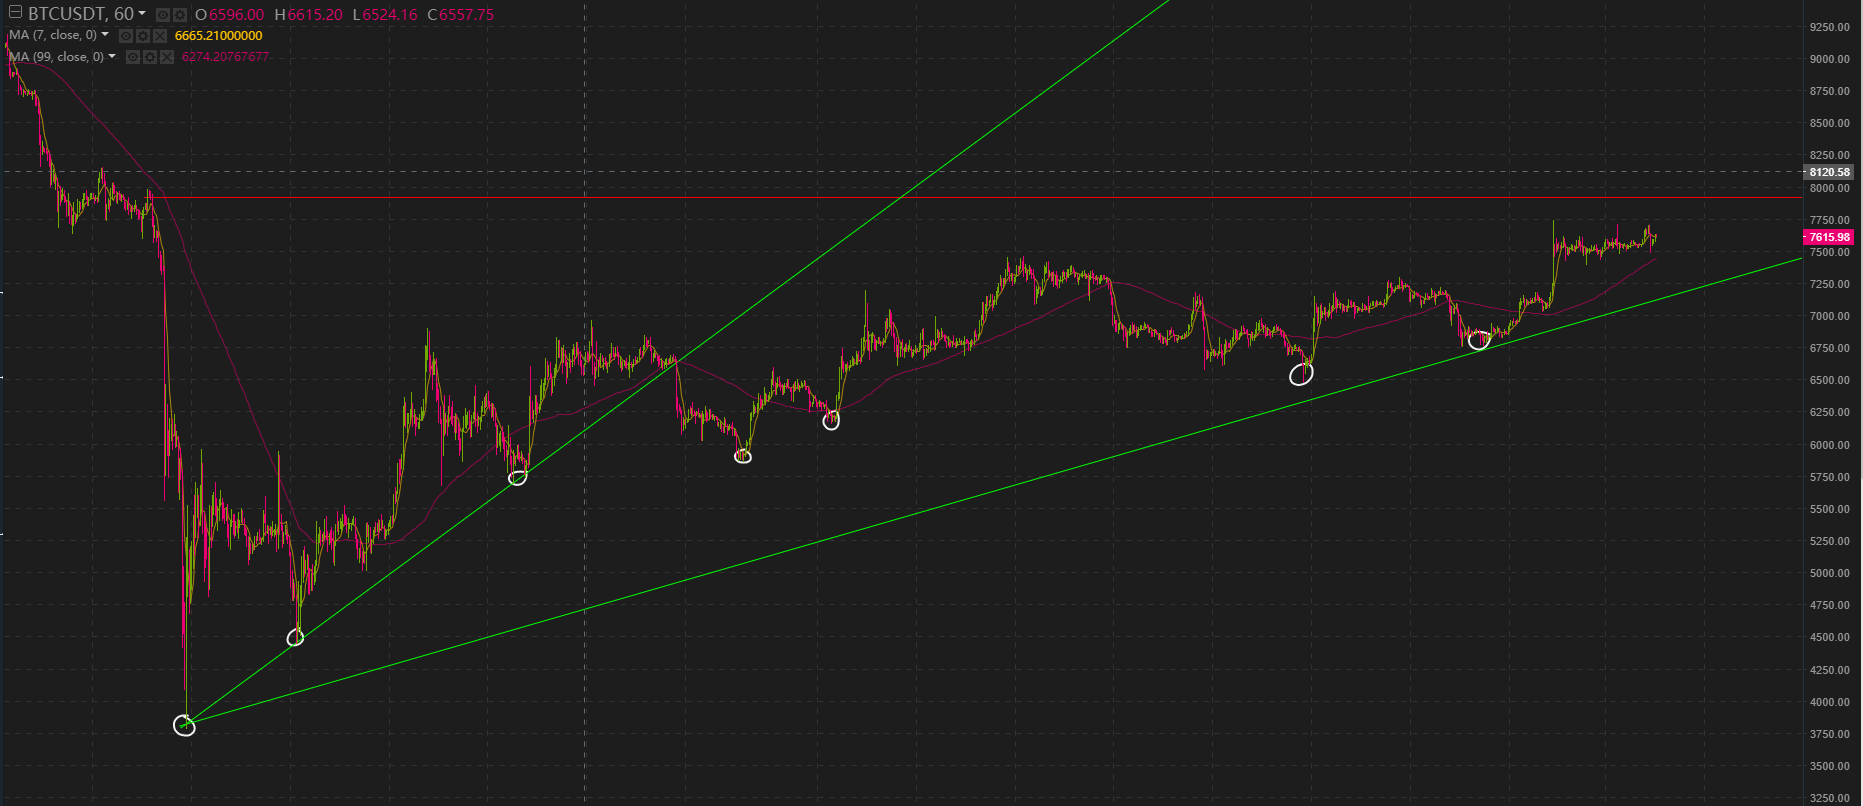
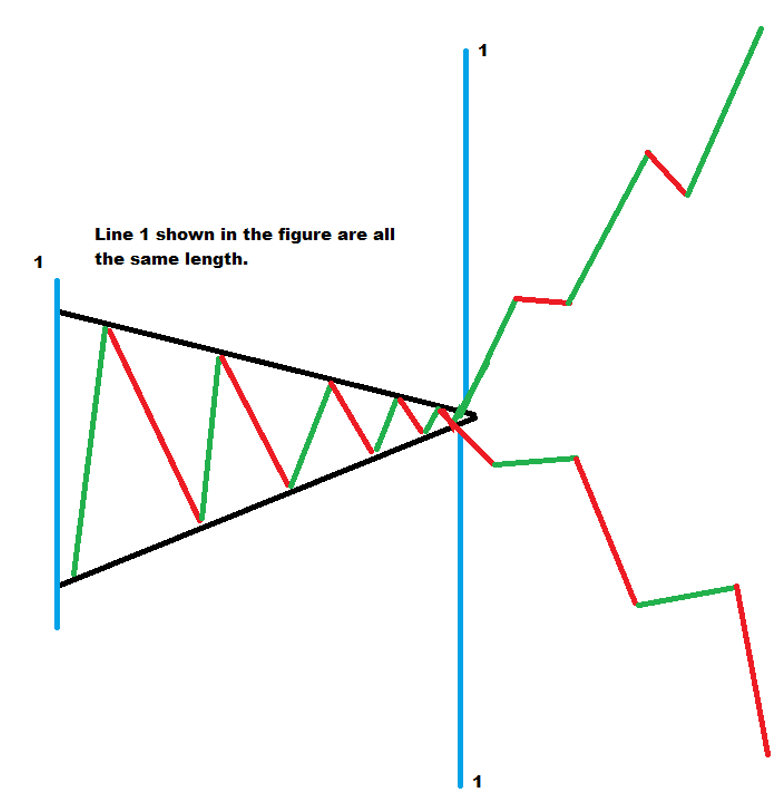
The Symmetrical Triangle
The Symmetrical Triangle pattern is formed by the two converging resistance and ascending support line. The symmetrical triangle is a continuation pattern which means it is bullish when it forms after a bull upwards trend. If it forms after a downtrend then it is bearish. The breakout afterwards can break up or down and is usually equal to the difference between the support and resistance lines at the beginning of the trend.
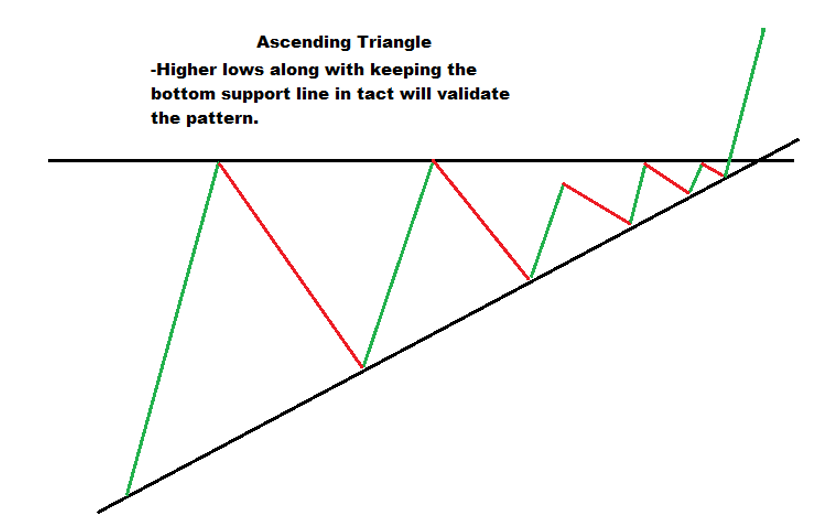
Ascending triangles
Ascending Triangles are often continuation patterns. The price will typically breakout in the same direction as the trend that was in place just prior to the triangle forming. Keeping the bottom support line valid while having a horizontal resistance on the top will strengthen the patterns continuation.
To: Hive community
From: Travis H.
Best wishes and stay safe!