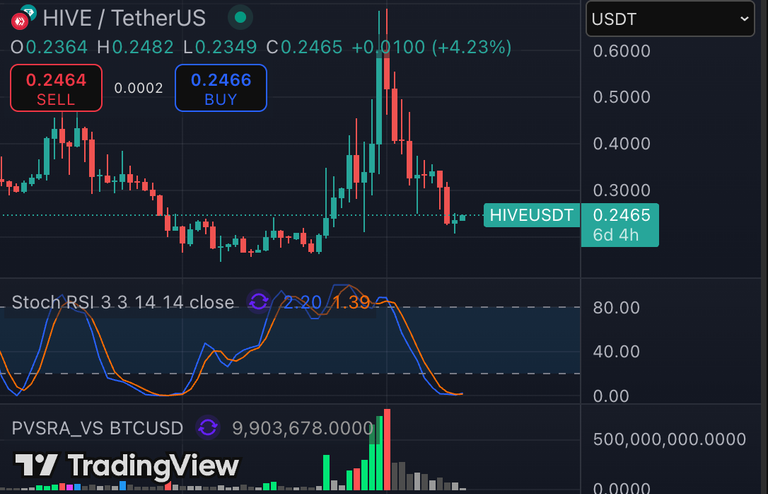
I do like the look of the weekly chart. With all the FUD that has been about we are still way off the previous lows and the selling volume seems to be reducing all the time all while the RSI is starting to turn up. Boolish!!!
I do like the look of the weekly chart. With all the FUD that has been about we are still way off the previous lows and the selling volume seems to be reducing all the time all while the RSI is starting to turn up. Boolish!!!
That's a great ZOOM OUT! I'm usually looking at 4 hours, and daily, but that weekly chart does look optimistic!
Let's see if we will consolidate for a few months, or if we will go up soon!