Recently i have been coming to know about various applications and their uses in my day to day life. One such application that i came to know recently is Qgis. I was completely unaware of this application until i joined uni. For those who are not familiar with the term "Qgis" , it is basically a software for geographical information system i.e storing and analizing the geographical data. Like earlier we used to put lat- long values while making a map, in Qgis we can do the same but this data is stored electronically. It is modern form of analizing and storing data. There are several other application which perform the same function which include arcgis, webgis but the main advantage of Qgis is, it is an open source platform. All you need to do is to go the the Qgis website and download it. Unlike other appications that will cost you more tan $100.
Today I was assigned to find the NDVI(Normalized Difference Vegetation Index)
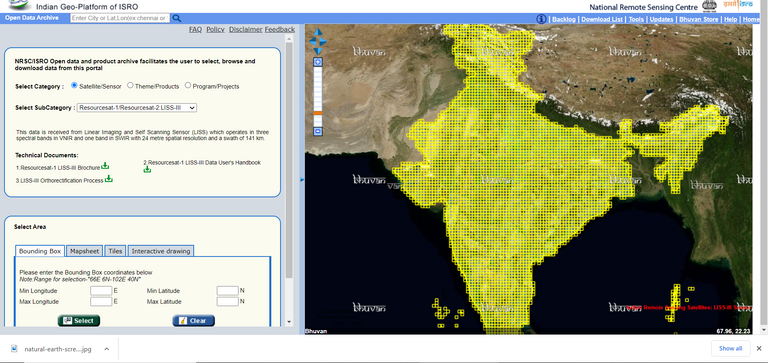
of a particular area using Satellite image. At first I needed a satellite image of the area .For that I went to the BHUVAN portal which is the Indian geo-portal developed by ISRO. NDVI is basically used to find the vegetation i.e greenness of the area. In BHUVAN portal I selected the category as Satellite, and in the sub category the sensor satellite whose IMAGES is to be downloaded. Below in the selection area , choose tiles and downloaded the desired area image.
A file is download as you can see it in the bottom left corner. The downloaded file contains images of several spectral bands. These different bands are necessary for calculating the NDVI.
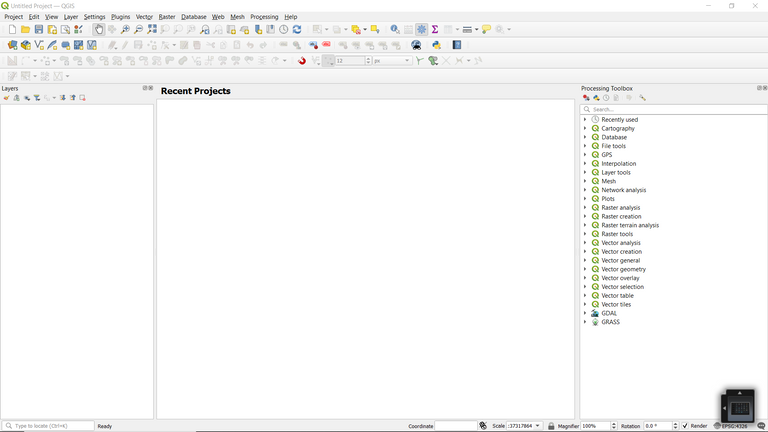
After downloading the images , I opened the QGIS software and the interface of the software after opening looks like this ----
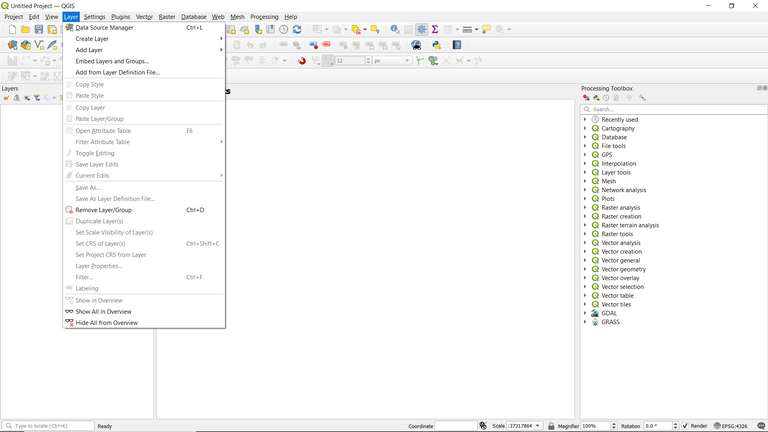
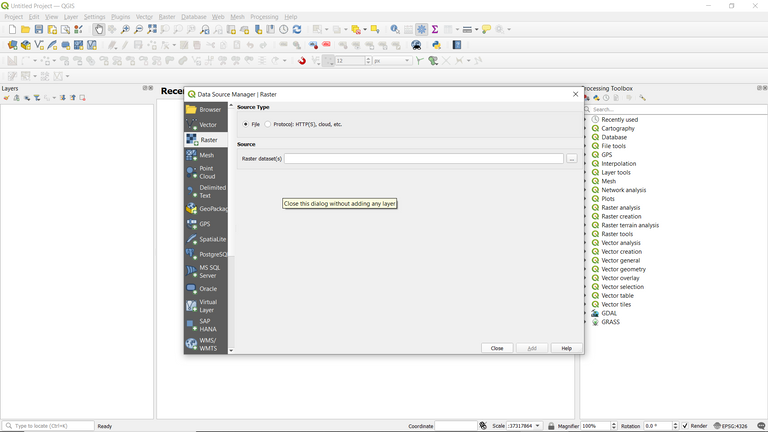
I added the downloaded images into the software and the procedure is as follows -----
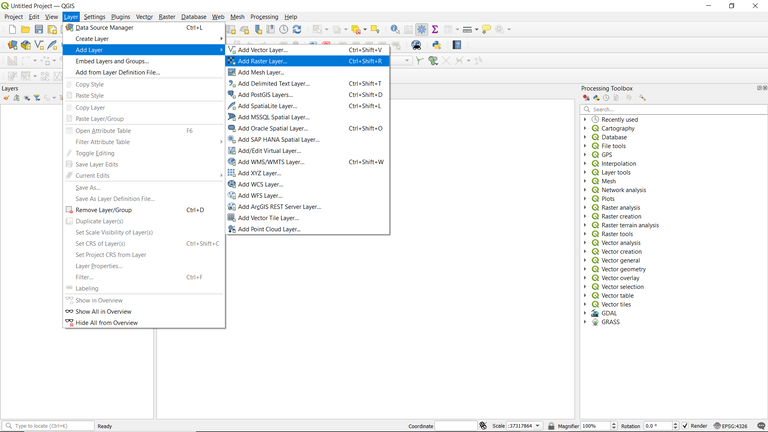
GO TO LAYER > ADD LAYER > ADD RASTER LAYER > SELECT THE DESRED PICTURES > CLICK ON ADD
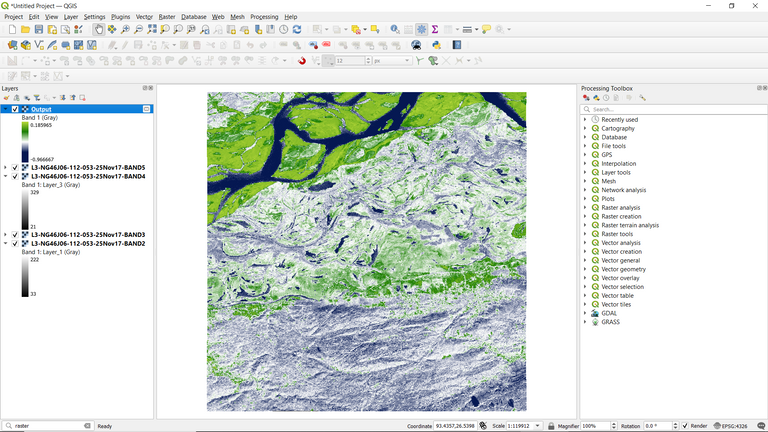
AFTER ADDING THE IMAGES INTO THE SOFTWARE, THE INTERFACE LOOKS LIKE THIS----
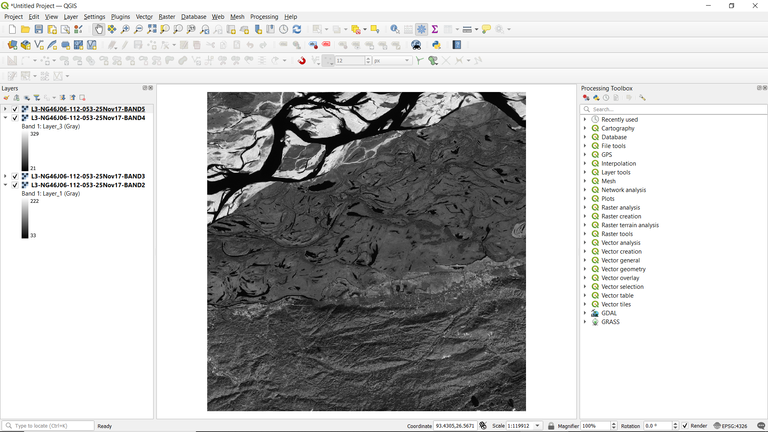
As the downloaded image is captured by satellite, so it appears black and white in color.
After adding the photo, I opened the raster calculator and entered the formula that is required to calculate the NDVI.
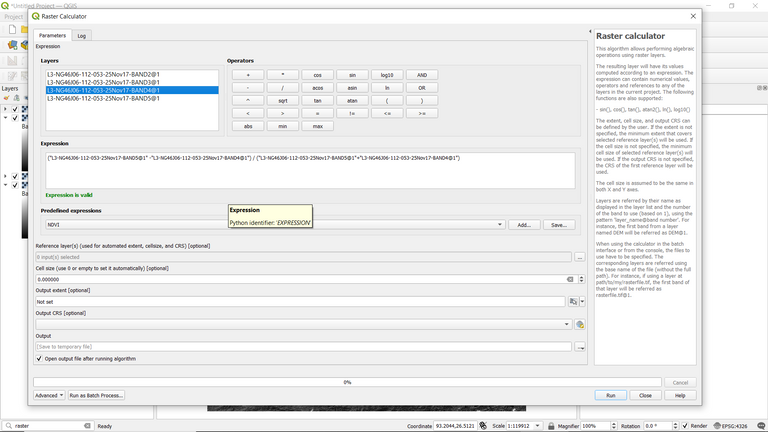
Here in the expression box, I put the required formula and green text below showed the validation of the formula. Then I clicked run option which made a new layer in the man interface which is the combination of all the 4 layers
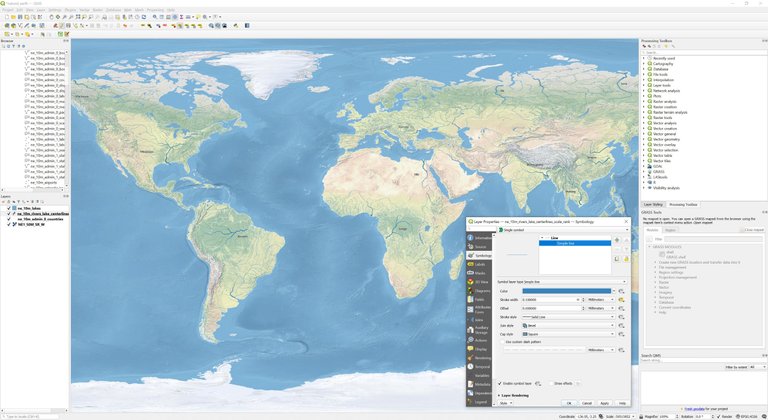
But the picture still appears black and white. To color the image I clicked on to symbology section and made adequate changes which resulted in outcome of a colorful picture.
In this picture one can interpret the features which can easily identify the forest area and land area and also the river line. The NDVI has values which allow the interpreter to know what feature it is. There are various earth features which can be calculated using NDVI. NDVI works on the principle that vegetation reflects more green color than any other color from the visible light. If the NDVI value is near 1 , it means the region has healthy vegetation . On the other hand if the NDVI value is negative it indicates the presence of water bodies , snow cover clouds etc.
Hope you found this post informative. Thanks for your valuable time reading this post.
SEE YOU SOON*


Discord Server.This post has been manually curated by @bhattg from Indiaunited community. Join us on our
Do you know that you can earn a passive income by delegating to @indiaunited. We share 100 % of the curation rewards with the delegators.
Here are some handy links for delegations: 100HP, 250HP, 500HP, 1000HP.
Read our latest announcement post to get more information.
Please contribute to the community by upvoting this comment and posts made by @indiaunited.
Very interesting article I just saw on geography. Blessing bro
Thanks