As I was writing my previous post I realized that the status page for PeakD.com has not been updated or improved for quite some time. So I decided to have a look at a couple of different services and compare them to the custom page we used for the past 2 years.

Bye Bye Old Status Page 👋
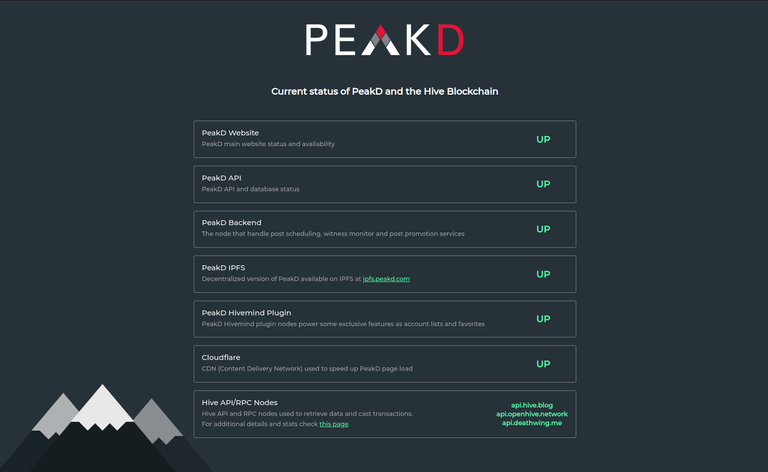
Before checking the new page let's have a look at the old one that worked quite well for the past couple of years.

Actually I still like the overall look of the old page, it's quite unique and customized to our specific needs. But there are a few flaws:
- No configuration and changes to the code are required every time we want to monitor a new system
- Not possible to track history and incidents
- Not possible to share updates in case something goes wrong and our team is working on a fix
- No contact point or link to reach out to us
- Limited to PeakD, no Beacon and no PeakMonsters
Of course some of the issues mentioned in the above list could have been fixed rewriting and improving the page, but before working on it I decided to do a quick comparison of other tools that are designed exactly for this specific purpose.
Quick Comparison of Status Page Services
On Hive we have better redundancy than other popular websites and applications as the whole system is way more decentralized. We can switch to different API nodes, use multiple login methods to interact with the blockchain and even use multiple awesome frontends.
But this also means that the monitoring tool (that is the essential part providing the data to the status page) must be easy to configure and flexible enough to actually monitor all those different services.
This is a short list of the best tools I checked and tried to configure to see if they can fulfill our needs:
UptimeRobot
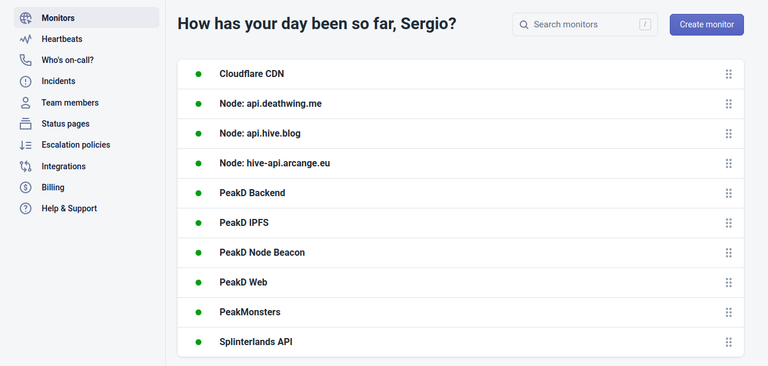
UptimeRobot is a great service, with a generous free plan that allows tons of monitors. Actually we have been using it for quite some time and we are still using it as the main monitoring tool of our infrastructure. These two screens should give you an idea of how we use this service even while we are on the go:

They also offer a status page, but there are a couple of drawbacks (maybe it's possible to solve some of them with more configuration but I've not been able to figure it out):
- Monitors support only GET requests. No support POST requests unfortunately and this is required to check the status of Hive API nodes
- Using a custom domain (like
status.peakd.com) requires a paid plan (not too expensive but not cheap either) - Check interval limited to 5 minutes, not too bad but there are other options with lower limits.
Instatus
Instatus is slightly different from the other solutions listed here as it offers the actual status page but not the monitoring tools. So it's a complimentary system that can be integrated with other services to unlock it's full potential (UptimeRobot and Better Uptime are both supported as many more).
There are some advantages in providing only the status page because having to focus on a specific thing allow the team behind this service to provide some great customization options and tons of different integration to receive notifications about downtimes.
Biggest downside is that for our small team is not optimal to manage and configure multiple services just to provide the status page.
Better Uptime
Better Uptime is a new service I discovered recently. I tried it out and I was really surprised by how easy it is to use while still allowing a bunch of different configuration options. Let's dive into pros and cons:
Pros:
- Possible to use a custom domain
- Easy to use and configure
- Allow monitors to use POST requests and is suitable for Hive API node checks
- Support multiple regions, so checks are not performed from a single source
- Check interval as low as 3 minutes
Cons:
- Free plan allows only 10 monitors
This is a very nice configuration dashboard 😯

Cachet
Cachet is an open source (https://github.com/CachetHQ/Cachet) solution that has been available for some time. I considered using it for it's huge customization potential, but I decided to move on for the following reasons:
- Take more time to be configured
- The status page is not looking so nice out of the box (compared to other solutions)
- Self hosting is time consuming, but even more critical is that if you host the monitoring solution for your infrastructure yourself you may experience issues on both your own servers and your own status page at the same time.
The last point was a deal-breaker for us because we don't want to build redundancy ourselves for a monitoring tool that should make our life easier, not more complicated 😆
Upptime
Upptime is by far the most cleaver solution on this list. Basically it's a monitoring system built on top of GitHub infrastructure and GitHub Actions. The whole thing is deployed as a repository (fork from the official one) and managed with standard GitHub features:
- Checks are performed using GitHub Actions, and you have infinite configuration options as you can write the code for those actions yourself
- Incidents are managed using GitHub Issues and are part of the repository. Also interactions on incidents is pretty easy as it is exactly the same you can do on GitHub Issues
- Status page itself is simply powered by GitHub Pages.
So are we using it? Actually no 😆 ...or not yet. Main reason is that we use GitLab as our code management system and I don't want to start using GitHub just for this. Also I would like to dig into it a bit more before making a final decision.
So What Are We Going To Use?
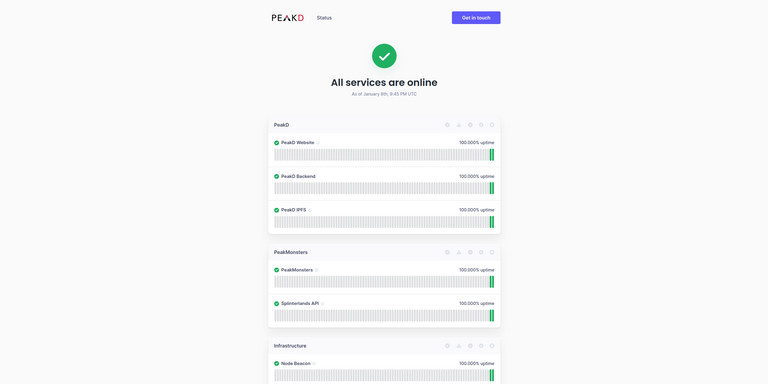
After checking all the above tools we decided to use BetterUptime for the time being. Main reasons are listed above in the comparison and here you can see a preview of the final page (or check yourself at https://status.peakd.com):

I know that some of you may prefer a darker version, but the new options and easy to use features we get with the new page are way more valuable 😉
What's next
My original idea is still in place and I plan to share some more details about our "way of working" next ...stay tuned !!
That's all for now, see you next time 👋
If you like what we do and you would like to get in touch feel free to reach out in our Discord server or if you are a developer have a look at this post.
We use Better Uptime at Vixio and it's proven to be very useful. Great choice and interesting to read about how you arrived at the final decision.
Thanks, I'm very happy about it so far and glad to know others are using it too :)
Nice. I like it. Cool breakdown of the different uptime tools. I had no idea there were so many.
Oh there are many more ...I focused on the few that seemed a good fit for us 😁
We also use Better Uptime for @rabona status page :) It works well even on a free plan!
Yep, great experience so far 👍
This is a great change and it look nice
well done!
Nice. I use UptimeRobot for some websites, but your choice is good. I'll try these others and maybe change it.
Tks
Thanks for sharing! This is very informative for me!
I found this useful, like many posts on Peakd. Sometimes I will tag in my comment the specific user that I want to see a great post for example @cryptocharmers. I am pretty new, so I don't know if this is the correct way. If I want one specific user of PeakD to be notified of a great PeakD post, is there a way for me to share just to that user while staying inside PeakD front-end?