Experimentally, a group of civil engineering students carried out a test to measure the breaking strength of a beam. To do so, they measured in a laboratory the breaking strength of the beam measured in pounds for a piece of 2 inches thick, with x in height and 12 in length, the results are recorded in the following table:

Once students obtain the experimental data, they are asked to fit the data to a mathematical model to which the data best fits.
To find out which model is the best fit, it is helpful to plot the data:
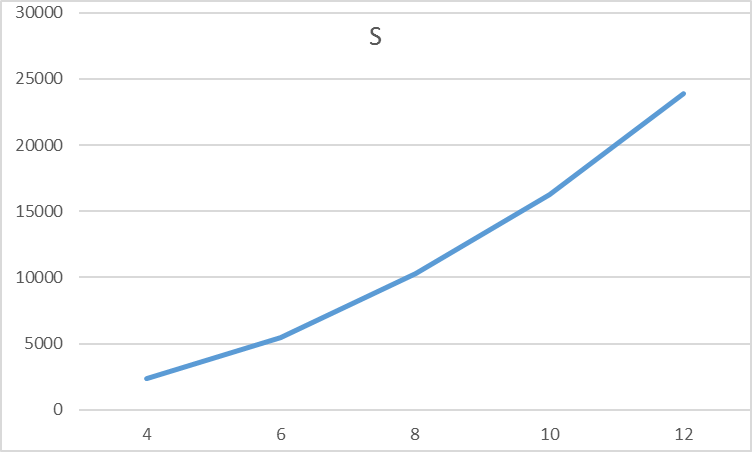
As can be seen, the graph seems to follow a quadratic model, which is why we will apply a quadratic regression model to obtain the function that best fits the experimental data.
The equation that best defines the quadratic regression model is:

To begin to get the quadratic function model we start by constructing the following data table:
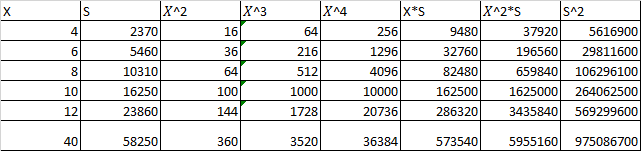
The first and second columns are the X and S values of the experiment data, then using Microsoft Excel finish filling in the other columns, each column has a summation in row number six.
The summary of the summations are as follows:
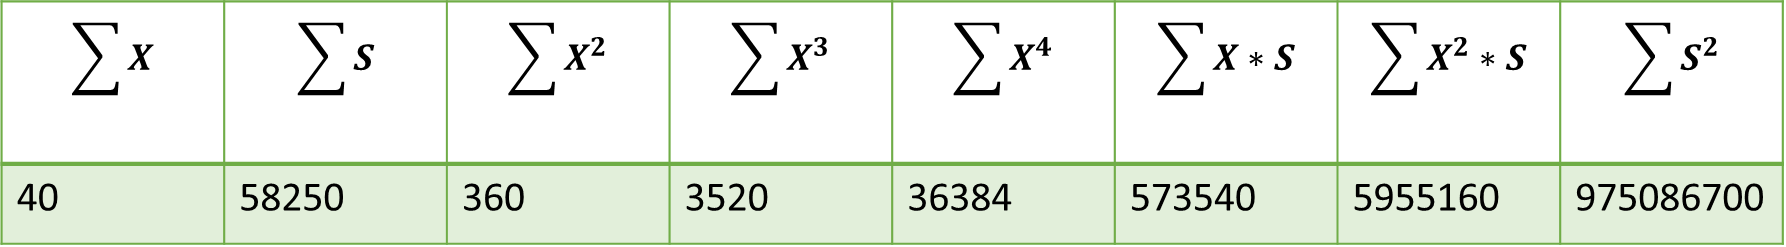
The next step is that with n= 5, since the experiment to measure the force resistance data for the beam rupture was 5 measurements, we proceed to calculate the following system of linear equations of size 3x3:


For this case I am going to solve the system of linear equations of size 3x3 by means of a scientific calculator:
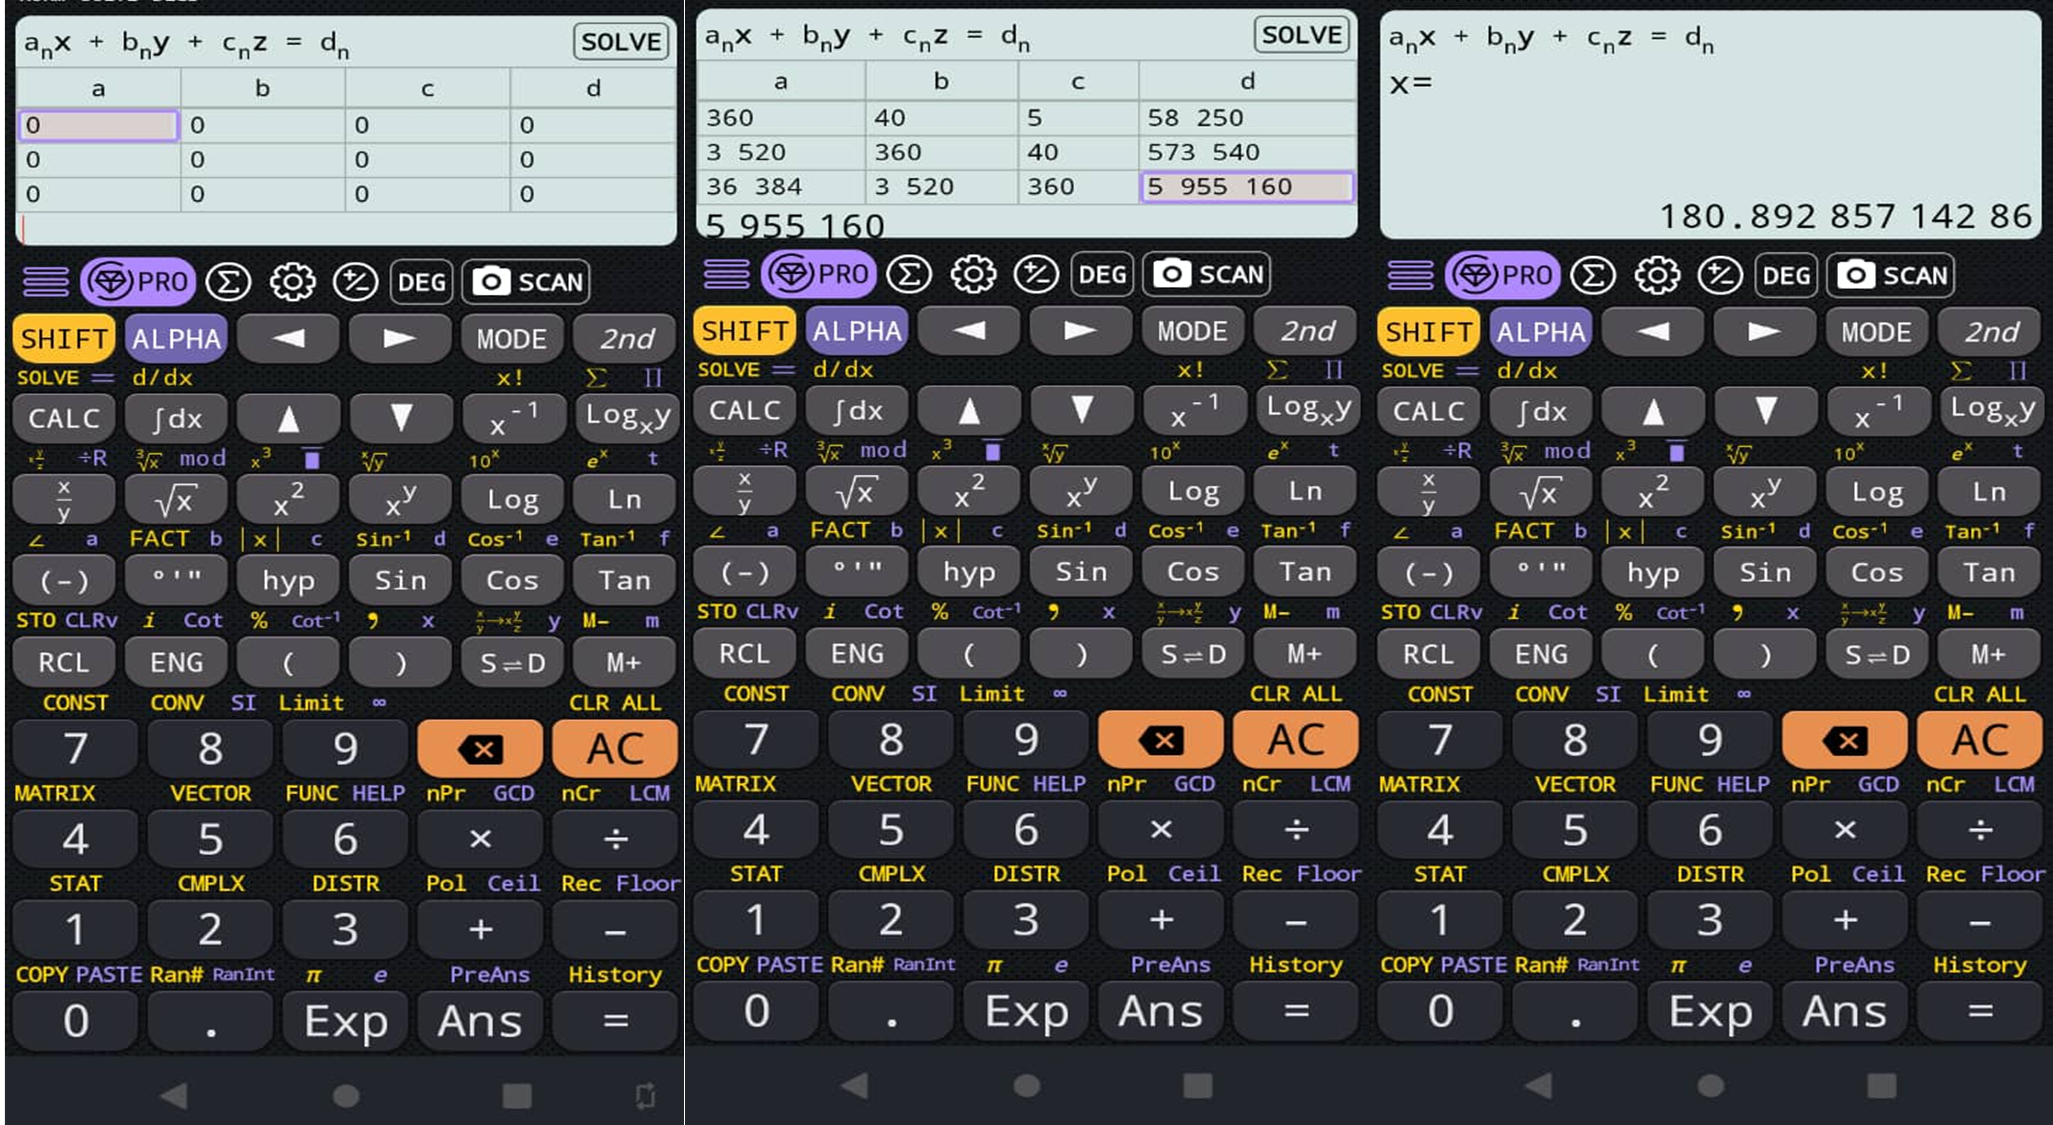
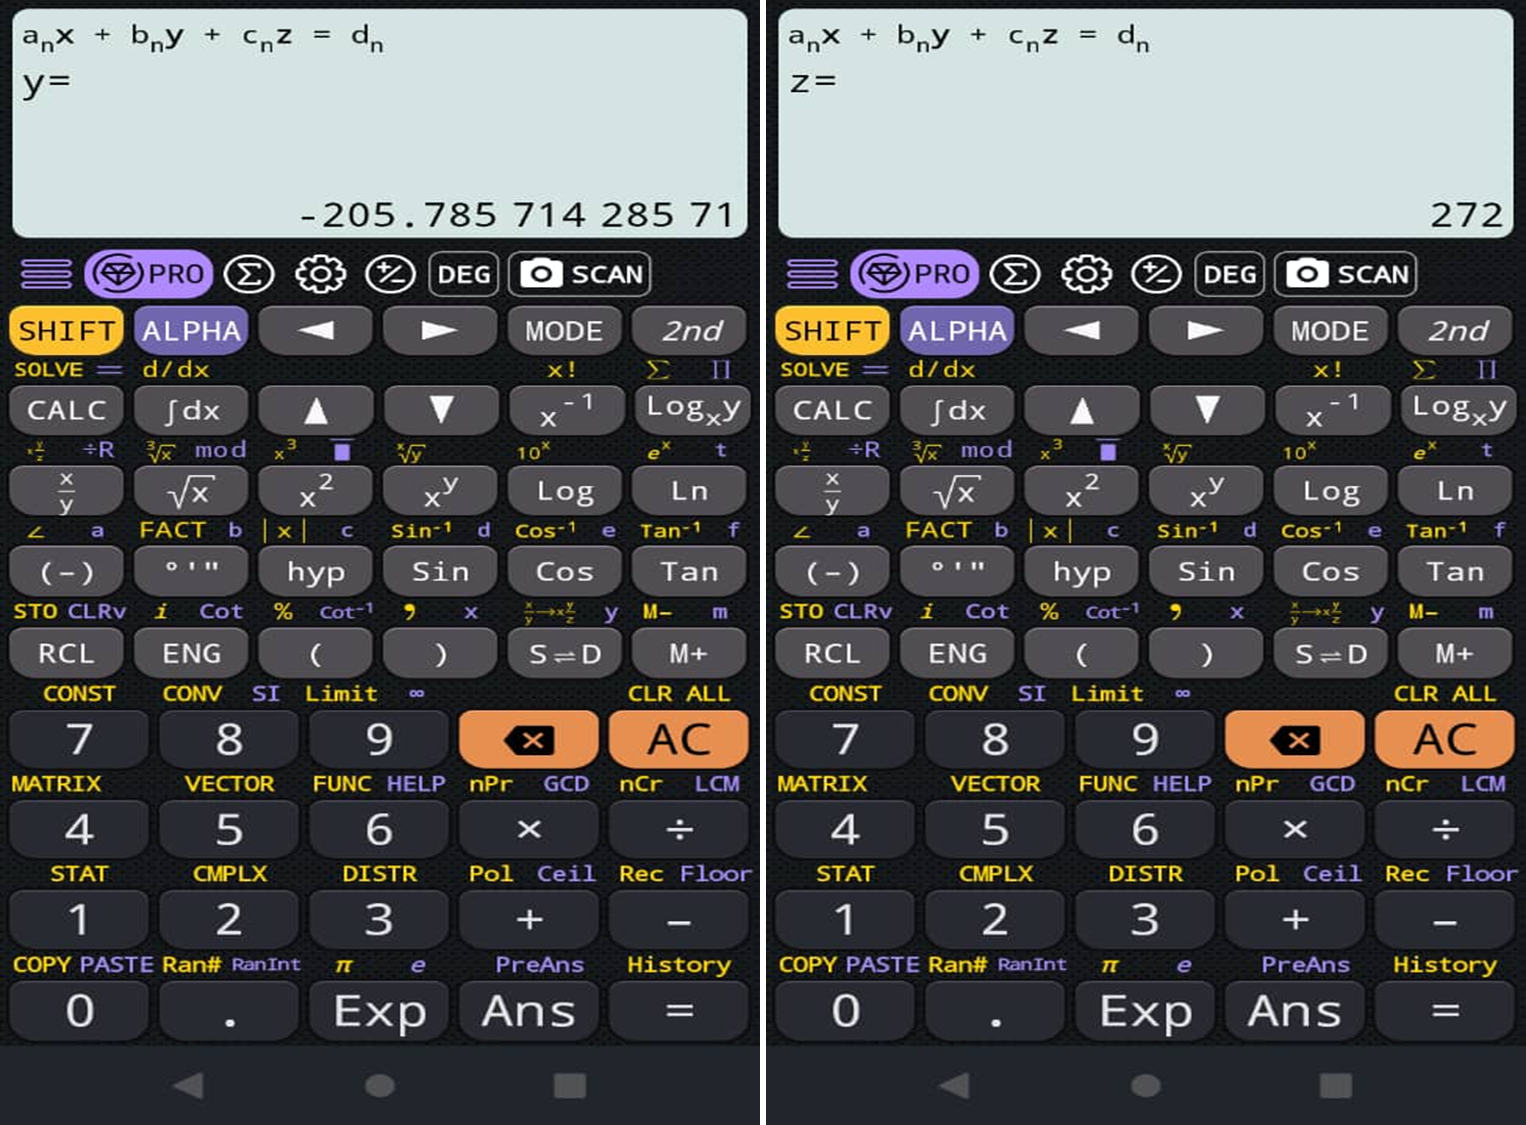
So we can say that:
a = 180
b = -205
c = 272
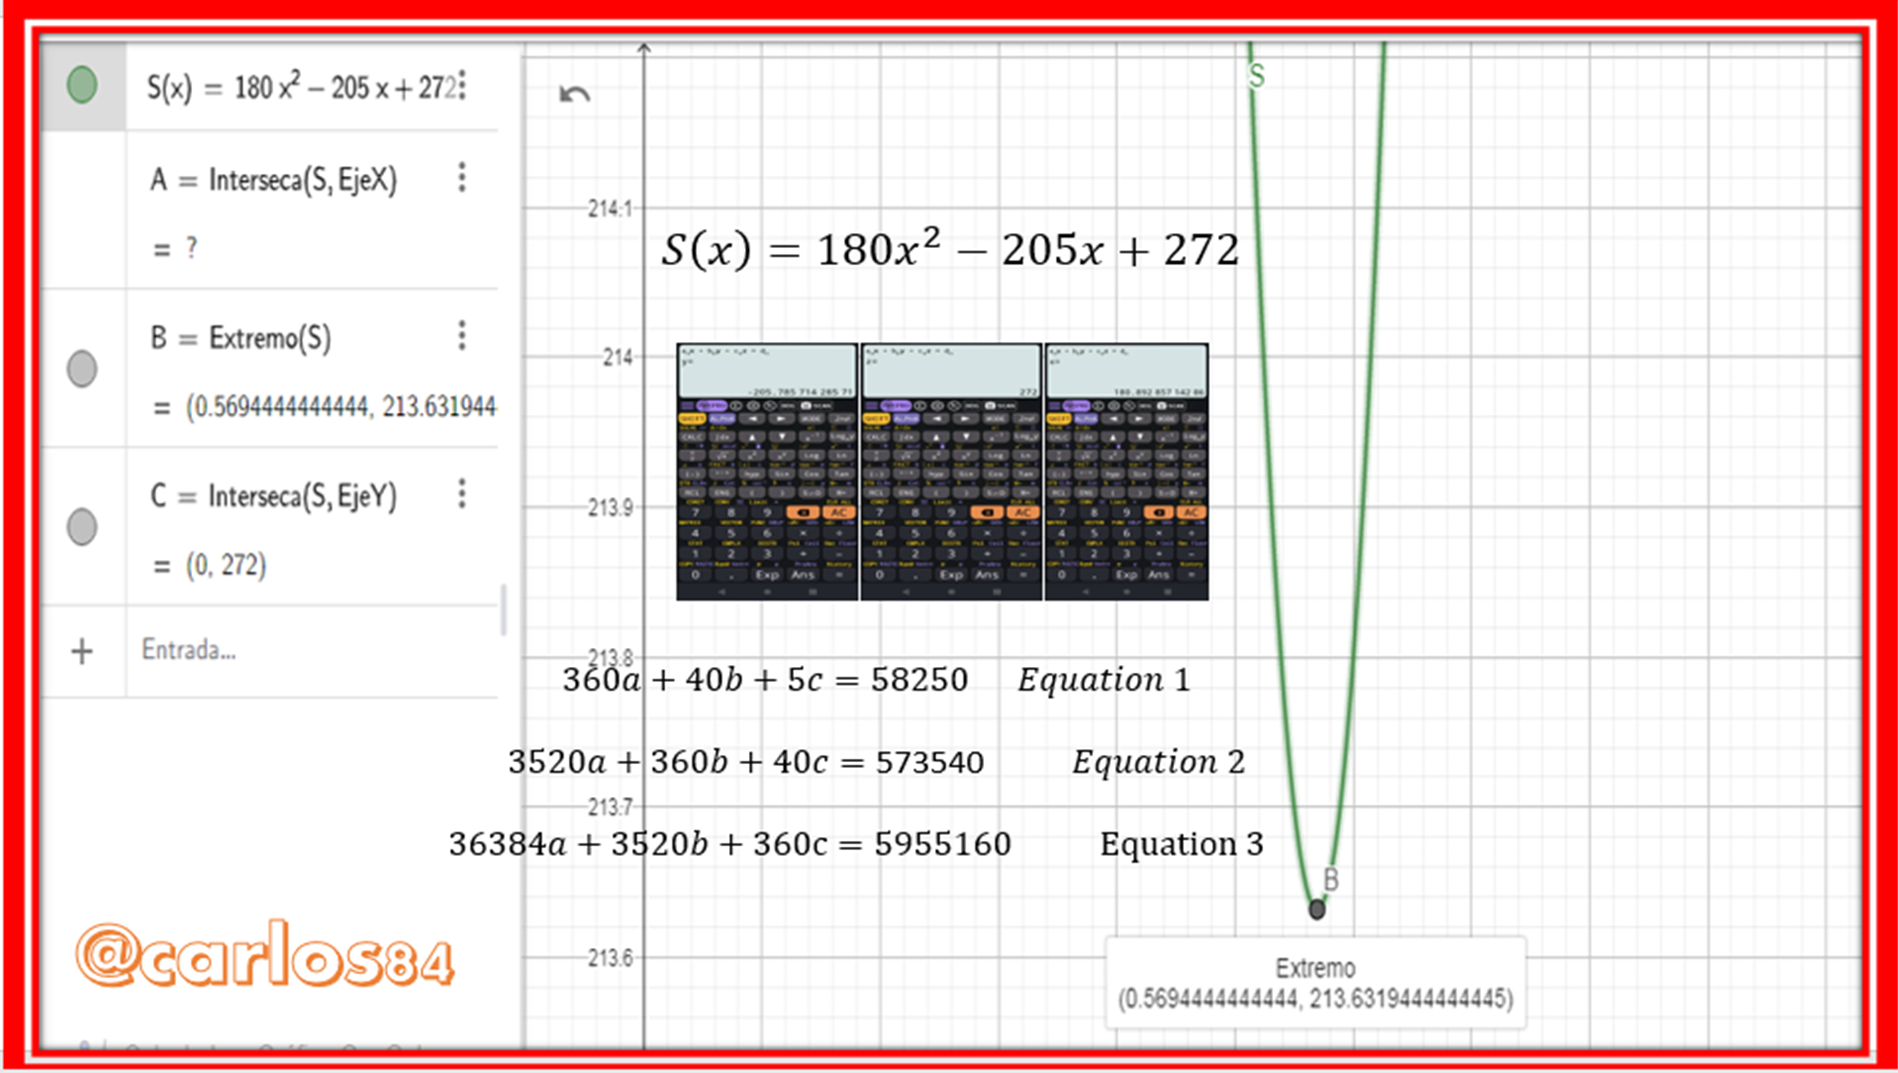
So the quadratic function S(x) is:

Conclusion and analysis of the quadratic model
Already obtaining the equation that best represents the data of the experiment, which is the quadratic function
We can estimate for example the values of the force at break of the beam when x = 2 inches, therefore:

The other question we can ask ourselves is:
For what value of x was the minimum value of the beam rupture force reached?
The value of x where the lowest value of the breaking strength S(x) is reached is at the vertex of the graph of the function S(x), since the function S(x) opens upwards, then the vertex represents a minimum point, let's see the construction of the graph in GeoGebra:
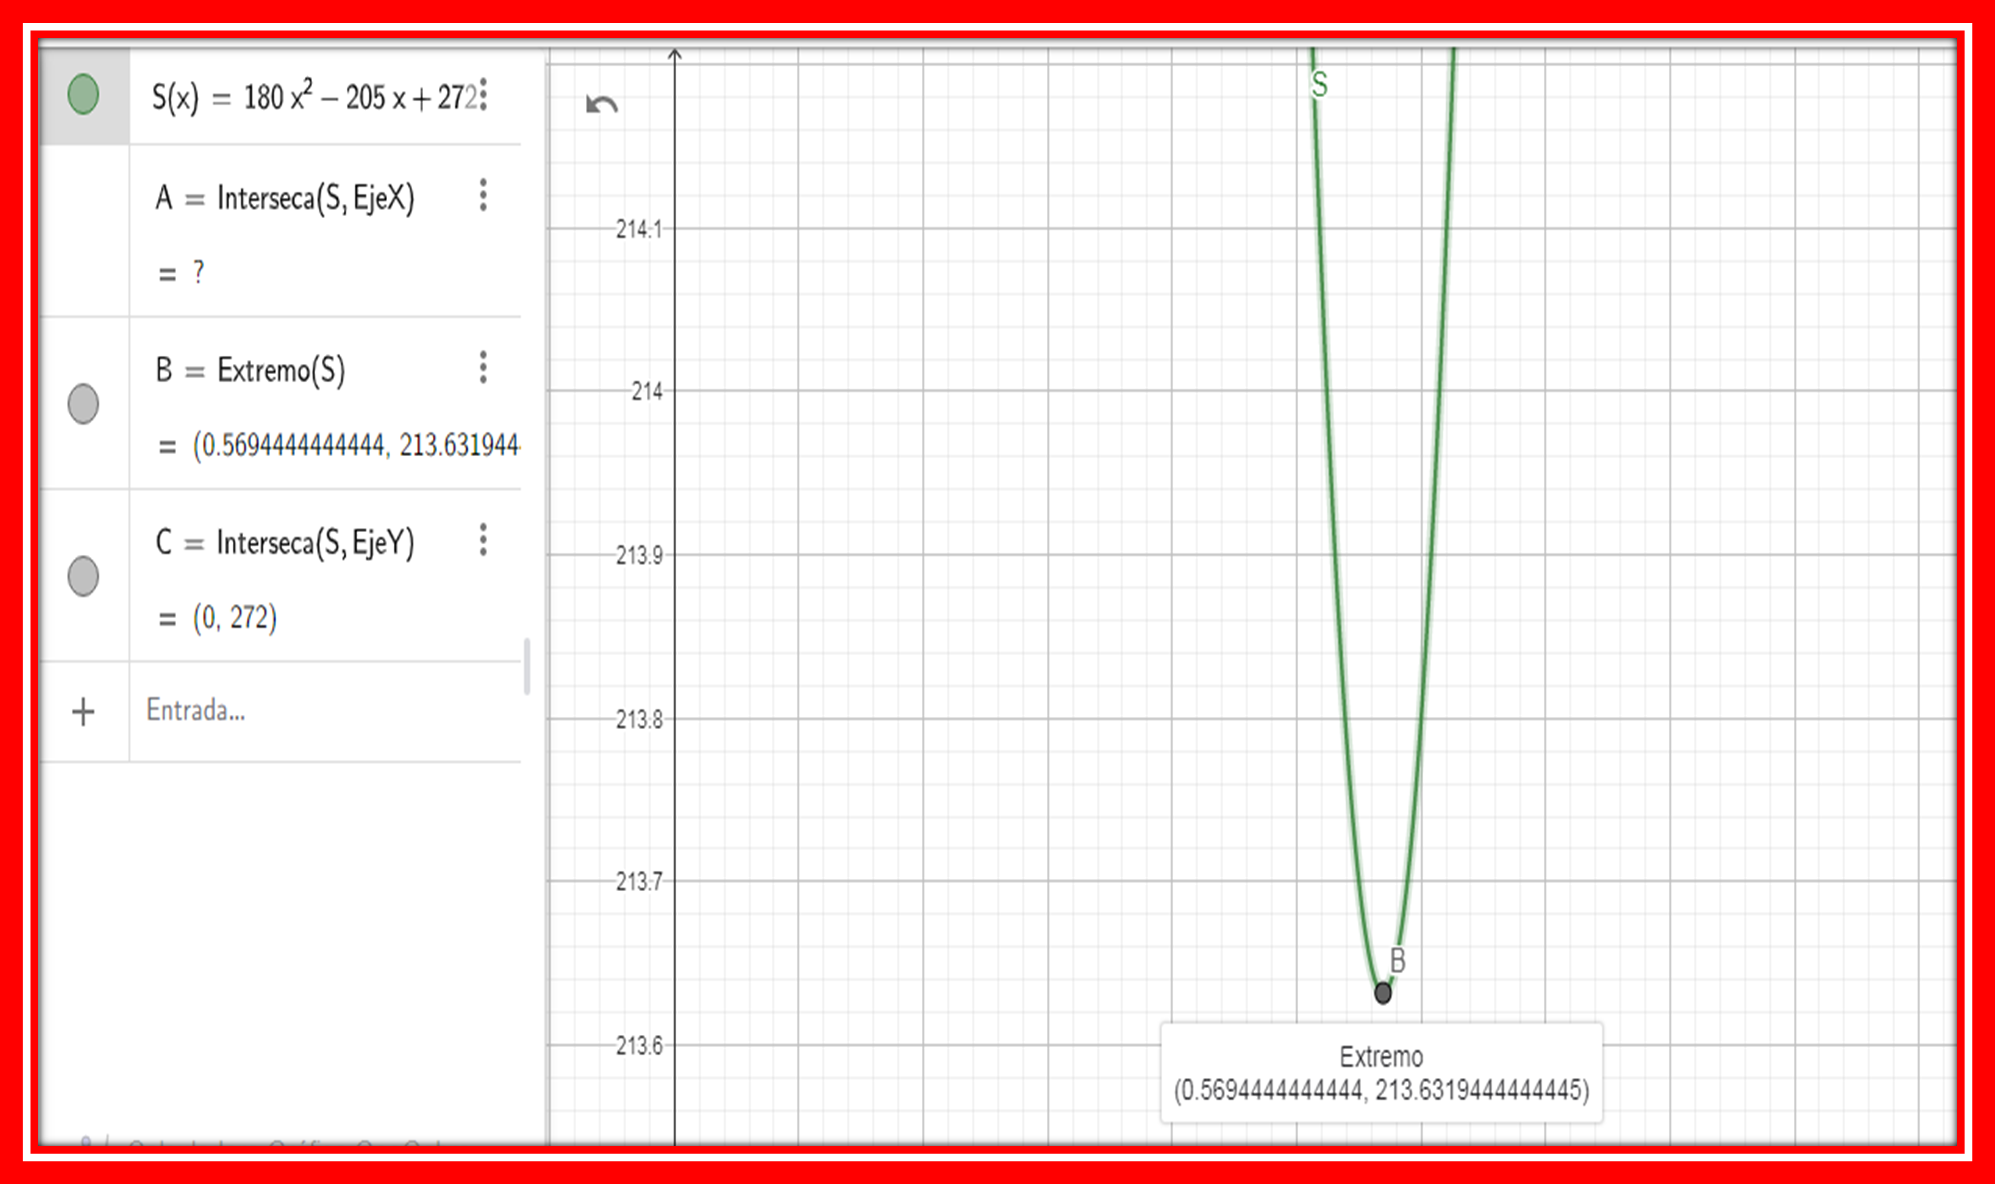
In the graph we can see that the coordinates of the vertex is ( 0.5694 ; 213.63)
So we can conclude that the lowest value of force at break of the beam is 213.63 PSI and it occurs when the value of the height (x) of the beam is 0.56 inches.
Recommended and consulted bibliographic references
Calculus book with Analytic Geometry by Larson and Hostetler. Volume I. 8th edition