post here . Since them people have been thinking about it, a KE 3 or over means that a user has been spending more rewards than stacking as HP. It gives you an idea, but judging only by the KE isn't so simple, that's why is recommend going deep into users' accounts. I have been reading a lot of the posts about @azircon, and it got me interested in it. We have been around for a while, and there are lots of posts in our blockchain, and also a big number of users! Its been some months since he published about the ratio between rewards and HP, which he called Krampus Co-efficient or KE, in this
That recommendation was given even by the same user that the KE give you a very rough idea of the reality, he answered something like that in one conversation. But something itched me if maybe there was some way to improve that number to still give an idea. So I got a small sample of users, which are anonymized. You can see how variable are they even being such a low number:
| Name | KE | HP | Rewards |
|---|---|---|---|
| User 1 | 8.86 | 361 | 3,205.75 |
| User 2 | 9.62 | 3,736 | 35,943.77 |
| User 3 | 1.04 | 49,872 | 51,653 |
| User 4 | 1.06 | 8,884 | 9,423 |
| User 5 | 0.21 | 26,305 | 5,573 |
For sure these users are just a grain from a beach, but one thing that I noticed is that the KE from User 1 and 2 are bad. But when I look the rewards of User 2 compared to other User it gives me yellow flag that maybe the KE putting both users at a similar level can be unfair perhaps, ok user 1 sold a lot of Hive, but still it we need to see more these difference on the data, but the KE currently brings some data so tight that it is hard to see. My first thought was to use the Rewards since it is the major spreading variable of the equation.
But KE is the ratio that shows the spread between rewards and HP. So I just needed a number to be multiplied that gives more difference. Also that shouldn't make so much change in the data. For small numbers using log on the base 10 is always a trick that can be used to reduce variability, and why not use the HP? So I multiplied the KE ratio by the log(HP). I also decided to name it according to some friendly advice to have some fun as TOKEN coefficient (or T. TOKEN stands for:
Token
Opportunistic
Kleptocratic
Exploitation
Number
After the math got these results with the same users:
| Name | TOKEN coefficient (Tc) | HP | Rewards |
|---|---|---|---|
| User 1 | 22.66 | 361 | 3,205.75 |
| User 2 | 34.36 | 3,736 | 35,943.77 |
| User 3 | 4.51 | 49,872 | 51,653 |
| User 4 | 4.18 | 8,884 | 9,423 |
| User 5 | 0.92 | 26,305 | 5,573 |
So here is the formula of TOKEN coefficient: Tc = (Total Rewards/ Total HP) * log (Total HP)
We still can see that User 1 is a Hive seller, but still not close from User 3 and User 4 which are around KE 1 with different stake sizes. Still User 5 which bought more Hive than was rewarded is under the value of 1. I decided to get some data from the blockchain to do some data exploration, random 1000 users with HP between 500 and 10k, I would say the big majority of our population perhaps? And also with Rewards over 1000 Hive. I am not filtering active users so I am not sure if some of them are inactive. I decided to filter those with KE > 3, the considered sellers. Well 164 of this 1000 population had KE > 3.
The interesting thing is that the Tc could spread the numbers more, so the numbers are a bit more distributed and you will find more spread data like the density plot below.
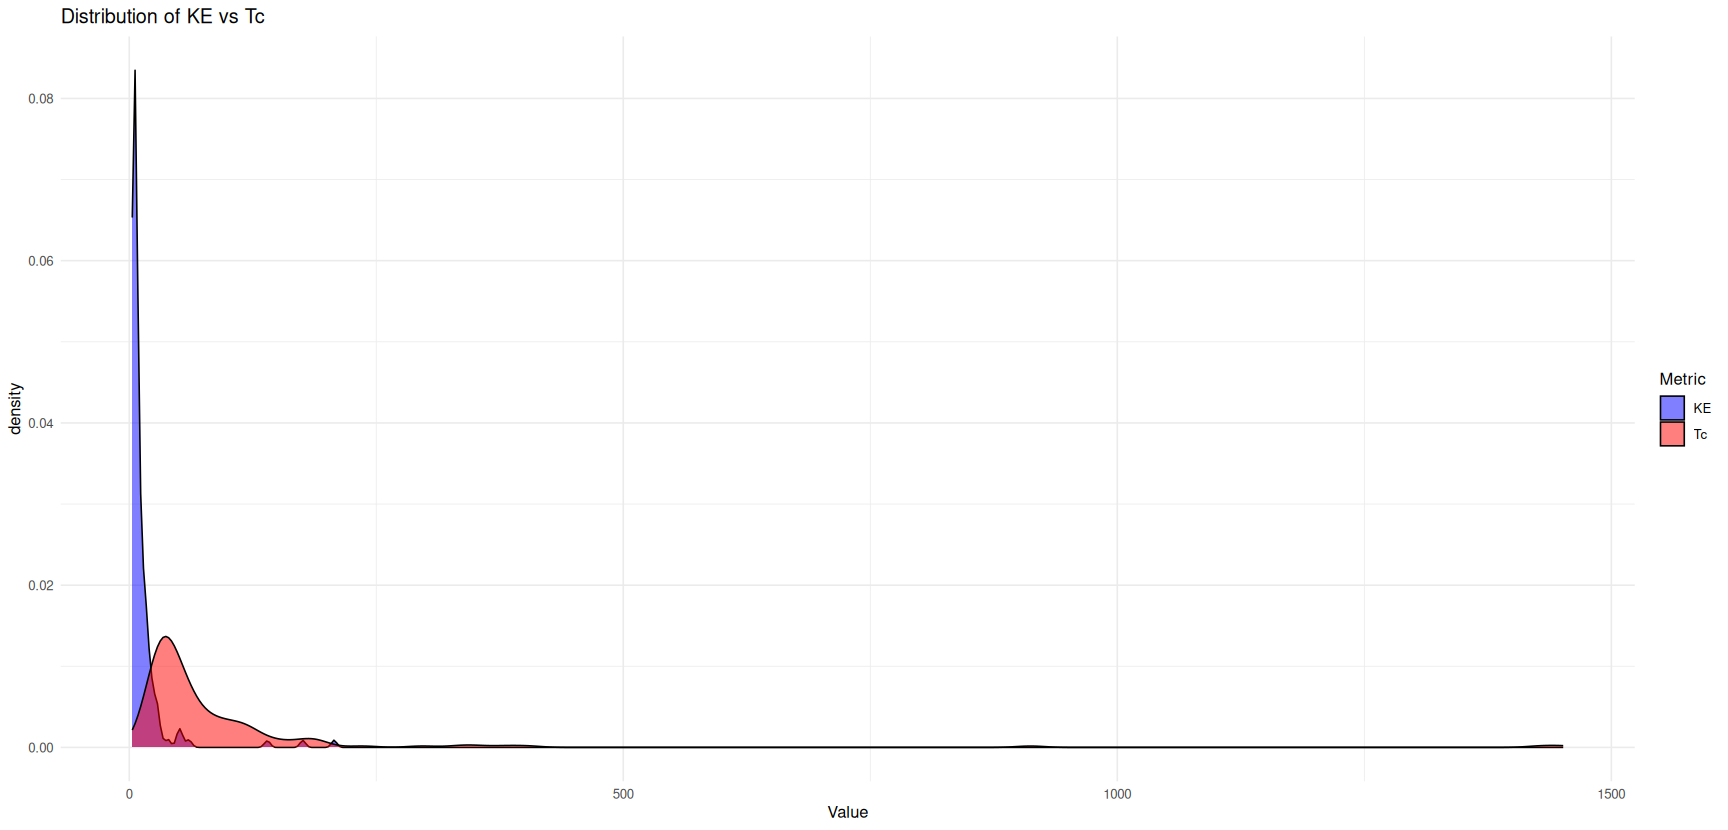
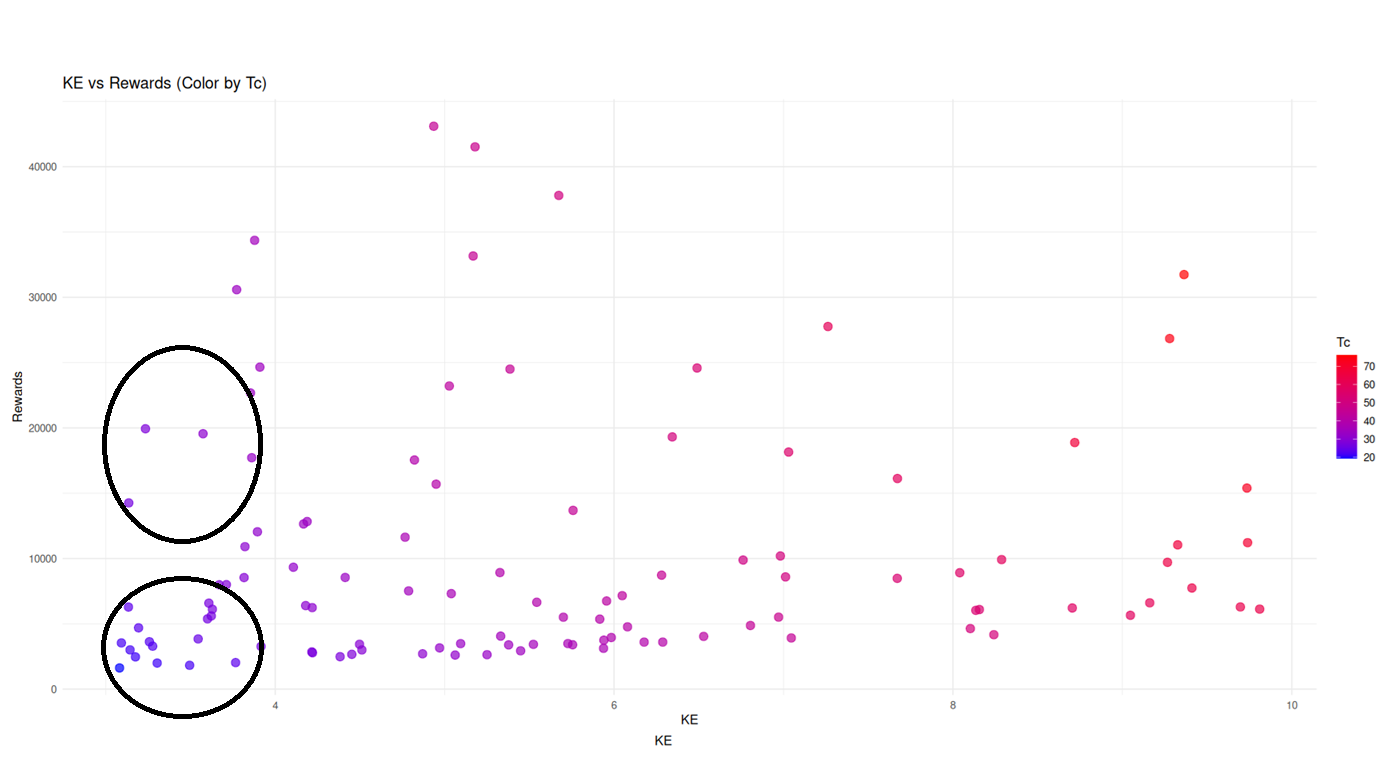
I had to remove the really huge KE numbers to visualize if I was seeing the same pattern as the tables above. I just analyzed KE between 3 and 10 for the next figure, and I can see that users with similar KEs have different colors which represent different Tc values like in the black circles below. You can verify the same pattern as you walk towards bigger KE values until it doesn't matter, very big KE values means also very big Tc values.
I am finishing the post but I think that this correction doesn't bring an enormous change to the usage of KE, it improves a bit the visualization specialty to remove misinterpretation of similar KE values. Maybe that will help a bit with the ongoing analysis of our big data of HP and Rewards. I am also open to better suggestions, I just think that we can improve this visualization.


post aqui . Já que as pessoas têm pensado sobre isso, um KE 3 ou mais significa que um usuário tem gasto mais recompensas do que acumulando como HP. Isso dá uma ideia, mas julgar apenas pelo KE não é tão simples, é por isso que é recomendável ir fundo nas contas dos usuários. Tenho lido muitas postagens sobre @azircon, e fiquei interessado. Estamos aqui há algum tempo, e há muitas postagens em nosso blockchain, e também um grande número de usuários! Já faz alguns meses desde que ele publicou sobre a proporção entre recompensas e HP, que ele chamou de Coeficiente de Krampus ou KE, neste
Essa recomendação foi dada até pelo mesmo usuário que o KE te dá uma ideia bem aproximada da realidade, ele respondeu algo assim em uma conversa. Mas algo me incomodou se talvez houvesse alguma maneira de melhorar esse número para ainda dar uma ideia. Então eu peguei uma pequena amostra de usuários, que são anonimizados. Você pode ver o quão variáveis eles são mesmo sendo um número tão baixo:
| Nome | KE | HP | Recompensas |
|---|---|---|---|
| Usuário 1 | 8,86 | 361 | 3.205,75 |
| Usuário 2 | 9,62 | 3.736 | 35.943,77 |
| Usuário 3 | 1,04 | 49.872 | 51.653 |
| Usuário 4 | 1,06 | 8.884 | 9.423 |
| Usuário 5 | 0,21 | 26.305 | 5.573 |
Com certeza esses usuários são apenas um grão de areia, mas uma coisa que notei é que o KE do Usuário 1 e 2 são ruins. Mas quando olho as recompensas do Usuário 2 em comparação com outros Usuários, isso me dá uma bandeira amarela de que talvez o KE colocando ambos os usuários em um nível semelhante possa ser injusto, ok, o usuário 1 vendeu muito Hive, mas ainda precisamos ver mais essas diferenças nos dados, mas o KE atualmente traz alguns dados tão restritos que é difícil de ver. Meu primeiro pensamento foi usar as Recompensas, pois é a principal variável de dispersão da equação.
Mas o KE é a proporção que mostra a dispersão entre recompensas e HP. Então eu só precisava de um número a ser multiplicado que desse mais diferença. Além disso, isso não deveria fazer tanta mudança nos dados. Para números pequenos, usar log na base 10 é sempre um truque que pode ser usado para reduzir a variabilidade, e por que não usar o HP? Então multipliquei a proporção do KE pelo log(HP). Também decidi nomeá-lo de acordo com alguns conselhos amigáveis para me divertir como coeficiente TOKEN (ou T. TOKEN significa:
Token
Opportunista
Cleptocrático
Eexploração
**Número
Depois que a matemática obteve esses resultados com os mesmos usuários:
| Nome | Coeficiente TOKEN (Tc) | HP | Recompensas |
|---|---|---|---|
| Usuário 1 | 22,66 | 361 | 3.205,75 |
| Usuário 2 | 34,36 | 3.736 | 35.943,77 |
| Usuário 3 | 4,51 | 49.872 | 51.653 |
| Usuário 4 | 4,18 | 8.884 | 9.423 |
| Usuário 5 | 0,92 | 26.305 | 5.573 |
Então aqui está a fórmula do coeficiente TOKEN: Tc = (Recompensas Totais/HP Total) * log (HP Total)
Ainda podemos ver que o Usuário 1 é um vendedor de Hive, mas ainda não está perto do Usuário 3 e do Usuário 4, que estão em torno de KE 1 com diferentes tamanhos de participação. Ainda assim, o Usuário 5, que comprou mais Hive do que foi recompensado, está abaixo do valor de 1. Decidi obter alguns dados do blockchain para fazer alguma exploração de dados, 1000 usuários aleatórios com HP entre 500 e 10k, eu diria que a grande maioria da nossa população, talvez? E também com Recompensas acima de 1000 Hive. Não estou filtrando usuários ativos, então não tenho certeza se alguns deles são inativos. Decidi filtrar aqueles com KE > 3, os vendedores considerados. Bem, 164 dessa população de 1000 tinham KE > 3.
O interessante é que o Tc poderia espalhar mais os números, então os números são um pouco mais distribuídos e você encontrará mais dados espalhados como o gráfico de densidade abaixo.
Eu tive que remover os números KE realmente grandes para visualizar se eu estava vendo o mesmo padrão das tabelas acima. Acabei de analisar KE entre 3 e 10 para a próxima figura, e posso ver que usuários com KEs semelhantes têm cores diferentes que representam valores Tc diferentes como nos círculos pretos abaixo. Você pode verificar o mesmo padrão à medida que caminha em direção a valores maiores de KE até que não importe mais, valores muito grandes de KE significam também valores muito grandes de Tc.
Estou terminando o post, mas acho que essa correção não traz uma mudança enorme no uso de KE, melhora um pouco a especialidade de visualização para remover a interpretação errônea de valores de KE similares. Talvez isso ajude um pouco com a análise contínua de nossos big data de HP e Recompensas. Também estou aberto a sugestões melhores, só acho que podemos melhorar essa visualização.
Posted using STEMGeeks
Need a name for the ratio :)
Can't be 'corrected KE Ratio" :)
Because that's lame,
You can call it whatever you want, but since you propose it, you get to name it :)
Hahaha i would name it something that brings some duality to the nature of the problem!
We can say Dichotomos Correction or value!
It is your coefficient, you can call it whatever you want. Inventor get to name it.
It is too formal it made me think about it and i was playing with some words instead!
TOKEN coefficient
Or
Token Opportunistic Kleptocratic Exploitation Number
I like it!
Maybe HBD savings should also be considered in the denominator since the funds didn't leave the chain anyway.
It depends of your question and how you interpret the importance of hbd for that reason! We arent considering those that leave hive liquid in the accounts as well but the problem is that the question to be answered is about staking hp X total rewarded hive!
Interesante, pero en el KE corregido, me gustaría que incluyera la antigüedad de la cuenta y algún tipo de promedio. Para que por ejemplo se pudiera identificar a los que venden desde el día 1, versus alguien que teniendo una antigüedad digamos de 4 o 5 años en HIVE en una ocasión por alguna emergencia tuvo que deshacerse de sus HP. Creo que eso sería más importante.
Buen aporte! También leí esos tópicos hoy, y sobre los "extractores", me parece hasta cierto punto razonable para cuidar el valor de HIVE, pero hay una gran proporción de Hivers que "trabajan" de esto de las recompensas... Es un tema espinoso.
!INDEED
Ya he pensado en eso… podemos agregar tantas variables como queramos… ¡podría ser un modelo lineal completo!
!LADY
View or trade
LOHtokens.@gwajnberg, you successfully shared 0.0100 LOH with @ladyaryastark and you earned 0.0100 LOH as tips. (1/1 calls)
Use !LADY command to share LOH! More details available in this post.
You can also tell how much has any account earned based on their reputation, it is based on the value of upvotes. Unless someone got downvoted a lot, it is quite representative.
Reputation can be used as a weight in a model. Since we expect that a larger reputation means more HP stacked! It is something to think how to add that. Like other people said before, time can be a weight as well. How old an account is? Since we see many high-rep accounts and very old accounts... we are transforming it in a linear model , if you are curious about it:
https://en.wikipedia.org/wiki/General_linear_model
It is an interesting game just need to have time to play with it!
O KE é uma ideia bem interessante, mas para mim realmente precisa pensar em mais variáveis para chegar perto da realidade de alguns perfis. Postagem top mano, sempre bom algo assim que ajuda a pensar e debater para melhorar.
Sim acho que muita gente chegou a essa conclusão. No entanto precisa-se tempo para pensar no melhor modelo... alguns ja sugeriram como Tempo (idade da conta) e Reputação variaveis que podem ajudar a aumentar a complexidade do modelo.
Isso aí, conversando e fazendo brainstorm podemos chegar em uma equação boa e justa.
Bzzt! Essa análise é gostosa! Eu também achei estranho que o KE não mostrasse a realidade toda. O seu método de usar uma pequena correção para o KE ratio pode ser uma boa ideia. Quero ver quais consequências vão surgir! #hivebr
AI generated content
Delegate your HP to the hive-br.voter account and earn Hive daily!
🔹 Follow our Curation Trail and don't miss voting! 🔹
Your post was manually curated by @shiftrox.Obrigado por promover a comunidade Hive-BR em suas postagens.
Vamos seguir fortalecendo a Hive