Hello friends
Today I am going to write another post which is about technical analysis. Most of us have no idea what technical analysis is.
Unless you know technical analysis. So you're not trading, you're gambling.
That is why I would never advise you to trade without understanding the technical analysis as it can cause you considerable financial loss. In today's post I will explain to you the basics analysis of trading. In today's post we will learn about trading candles. What effect do these candles have on trading?
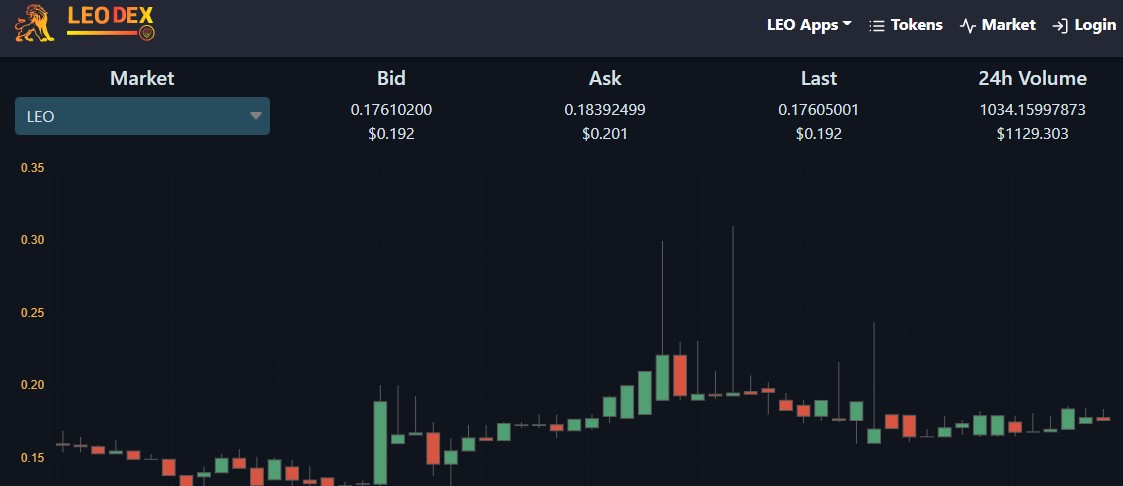
Friends, you may have seen the chart of Candles Sticks in any trading market in which some Candles Sticks have gone up and sometimes down. As you can see in the picture below.

And in some markets we can set these candlesticks according to the time. We can set the chart at 1 hour or 1 day or 1 month or we can set it at 5 minutes. And this time is because these candlesticks tell us how much this coin moved up or down in an hour or a day.
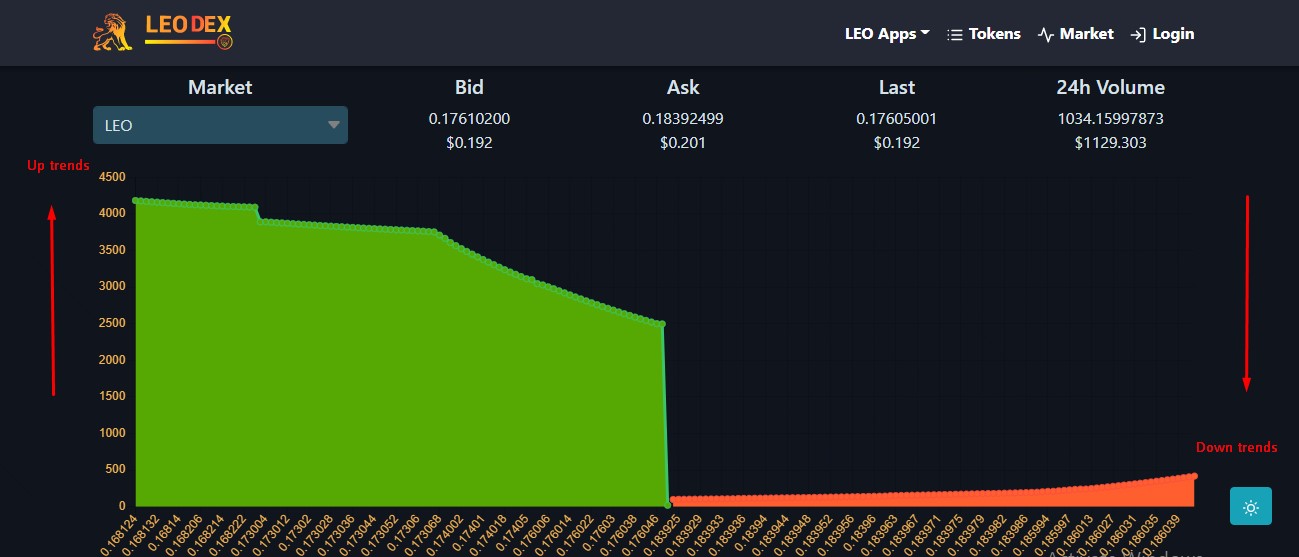
Friends, first of all let me tell you that people look at most of the trends in the chart ie up trends and down trends. see in the pic below

In other words, people see what is up trend and what is down trend. All you have to do is see when the trend is going up, you have to catch the trend and when you see the trend going down, you have to leave the trend.
This means that when you see a trend up, you invest on this coin and when you see a trend down, you withdraw investment from this coin. And besides, you have to make sure that the coin belongs to the company and that the company belongs to someone and that it is not cheating you.
Once you understand the trend, it will not be difficult for you to understand the candlesticks.
These are just some basics of trading analysis that you can use. I will keep posting for you from time to time regarding trading
Posted Using LeoFinance Beta