Crypto market remains unexpected, and even experts cannot predict with 100%. This is because there is much more volatility in the market and also there is manipulation, which brings more suspense in the market, and thus no one can predict this market.
There are also cases that a trader, based on its experience and learning skills, can predict the price of any coin, and that is probable that it goes correct with 70 to 80%.
In this post, I will try to predict about the price of hive coin based on my experience and chart analysis, which I drawn different patterns. This post is more special for the traders and more than that for hive users because you will come to know about the coming move for the price.
As we did see that last week the price of hive pumps more than 42%, reached the level of 0.4551, where I also mentioned that 0.3775 will be it's good support. If in case it breaks this level, you will see it next to 0.3014. The same happened, and the price did reach the level of 0.3 mark.
Today I was reading some of the charts of different coins for finding any trade. I thought to look up on the chart of hive. What I did see in the price of hive makes me really worry about the coming days.
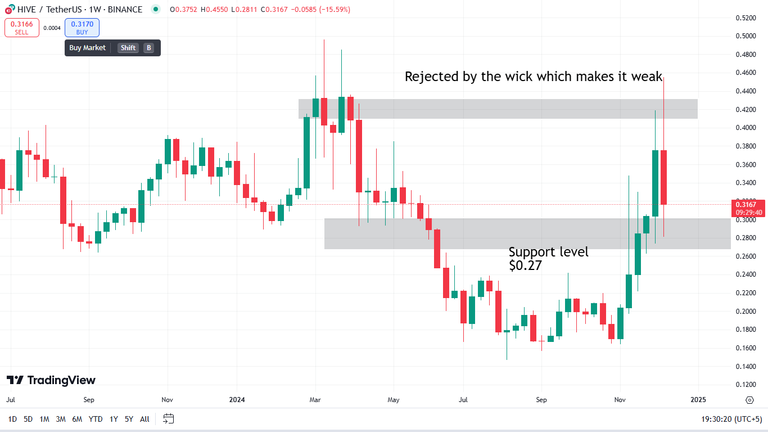
According to weekly basis, I find it very weak, and there's more expectation that the price will go to test the level of 0.27 within few days.
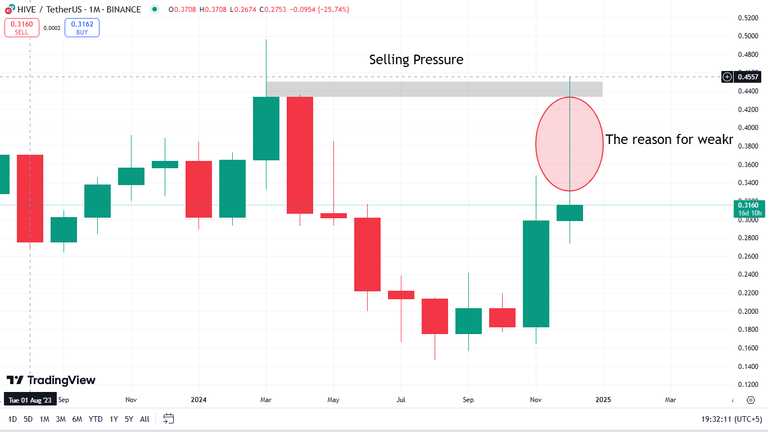
This is because if you see in a weekly chart of hive, you will get to know that there were multiple of rejections from the 0.4245 resistance level. The rejection was with the wicks. If we did see that the candle body reached that level, then there will be no worry for price and we could say that the price seems to be more strong the next week.
But unfortunately, we did see that the body doesn't stay on the resistance level, but only the wicks goes and test the level but rejects. Now according to weekly chart, you will see that the body of the candle is much more weak and is now testing the support level.
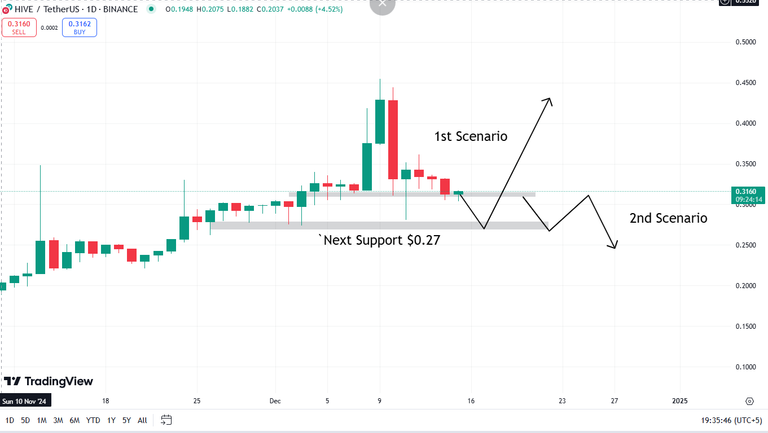
When you go to check one day time frame, again you will see four to five consecutive red candles, which makes the it weak. According to one week and one day time frame, it is telling that the price of hive at least will test the level of 0.27 within coming days.
If it holds this level, then surely it will go bounce back to again test the level of 0.3152. But if in case of rejection, the next mark will be 0.25.
This is what I find in the weekly chart of hive. According to my experience, learning and knowledge, it looks for me that the price of hive is looking much weaker according to weekly time frame, and there is more probable that the price will at least test the level of 0.27 mark.
The purpose of this post and telling about this analysis is to make you guys aware about the possible next move of hive.
This is again my prediction, and there's possibility that my prediction goes wrong. So do your financial advice before taking any trade.
I hope you find this post interesting and I hope you will like it. If you like the post, please leave feedback in the comments section so that the next one will be even better. Thank you for sticking with me until the end.

TWITTER TELEGRAM HIVE WHATSAPP DISCORD
IMAGES AND GIF TAKEN FROM CANVA, EDITED IN CANVA
Image Source
REMEMBER: We should prepare for the unexpected and hope for the best. Life may not be easy, but you must do your best and leave the rest to God.


