
Trading is now the order of the new world. Trading could be very profitable if it’s well understood. Today I would like to talk about one of the powerful strategies in crypto trading (wedge patterns). Without wasting time let’s dive into the lesson.

Concept about wedge patterns

The wedge pattern is one of the numerous line patterns used in trading. Wedge patterns are trading patterns in which two trend lines converge at a point on a chart. It happens when a support and resistance trend line meet.
Wedge patterns are trend pauses that can occur in the middle or at the top of a trend.
It's beneficial to recognize wedge patterns in the market.
Both trend lines start a little apart, but as the market moves, they become closer until they intersect at a point.
This wedge can appear in any market movement, whether it is up or down. It usually happens in the middle of a trend, with volume building up to allow it to burst out of the wedge and make a major move. Traders may make a lot of money quickly with wedge patterns because of the momentum after the breakout.
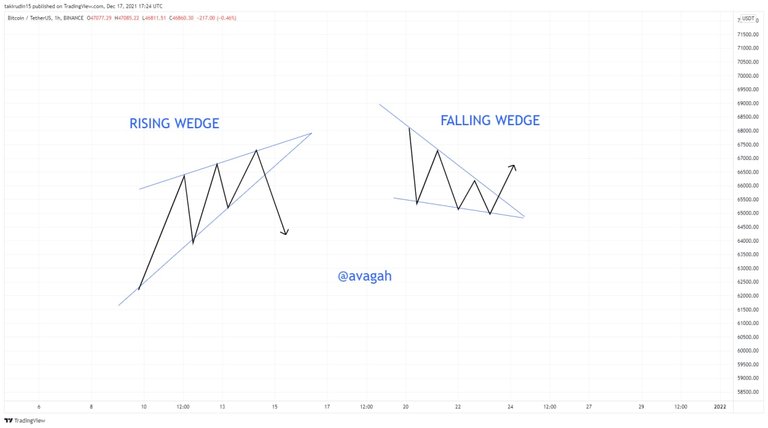
According to the image above, the market was trending up and a bearish breakout occurred for the rising wedge, while the market was trending down and a bullish breakout occurred for the falling wedge.

The two types of Wedges

Wedge patterns are divided into two groups.
- Rising Wedge
- Falling Wedge
Rising Wedge
A rising wedge, also known as an upside wedge, occurs when there is an upward movement, and the market develops a structure with higher lows and higher highs. A rising wedge is formed by drawing a line through all of the lows and highs. The market breaks down to the downside when this structure is developed.
The resistance line is drawn through all of the highs, while the support line is drawn through all of the lows. The convergent line is formed when both lines travel toward the same point. The price breaks the support and reverses into a bearish trend after this upward movement is developed.
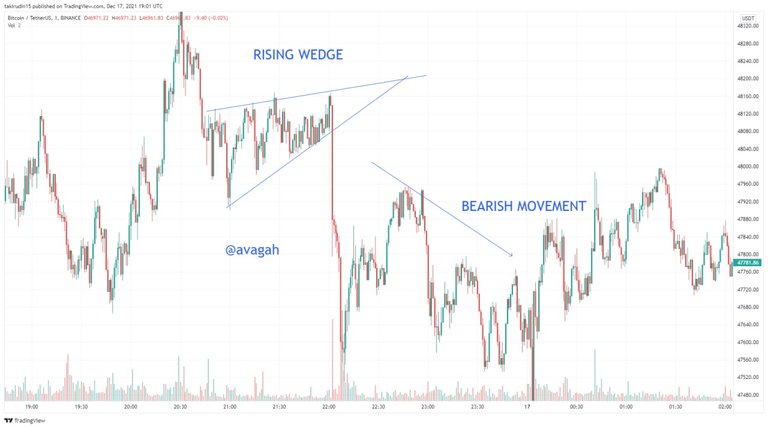
The picture above shows an example of a rising wedge. The price was consolidating within an uptrend and a strong bearish breakout happened after.
Identifying Rising Wedge
To identify a rising wedge, you have to find a trend that is moving narrow.
Draw a trend line through the swing lows and another one through the swing highs
The price must touch the price resistance at least 3 times and at least twice at the support.
Falling Wedge
A fallen wedge, also known as a downtrend wedge, occurs when the price forms lower lows and lower highs. One trend line runs through all of the swing lows, while the other runs through all of the swing highs.
The support line is formed through the lows, while the resistance line is drawn through the highs. Both lines are convergent, meaning they are heading in the same direction.
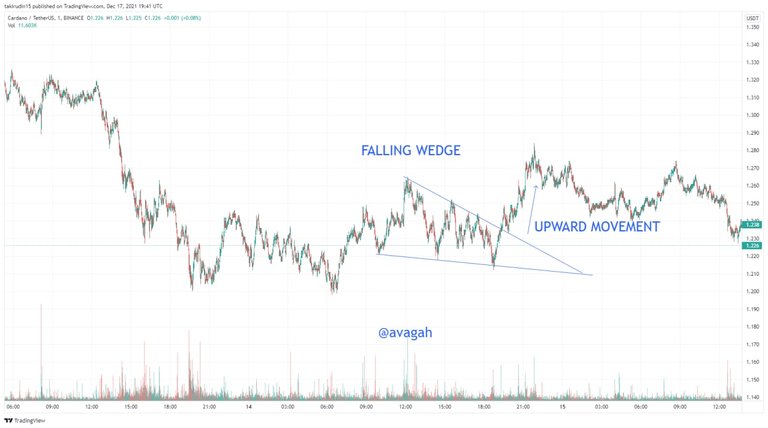
A fallen wedge is in the image above.
Price moves in a lower low and lower high pattern before breaking through the resistance drawn through the lower highs.
Identifying Fallen Wedge
Find a downtrend moving narrow
Draw a trend line through the swing lows and swing highs
The price is supposed to touch the support trend line at least 3 times and touch the resistance trend line at least twice
The volume must be declining

Taking trades with the wedge patterns

Trade for a rising wedge
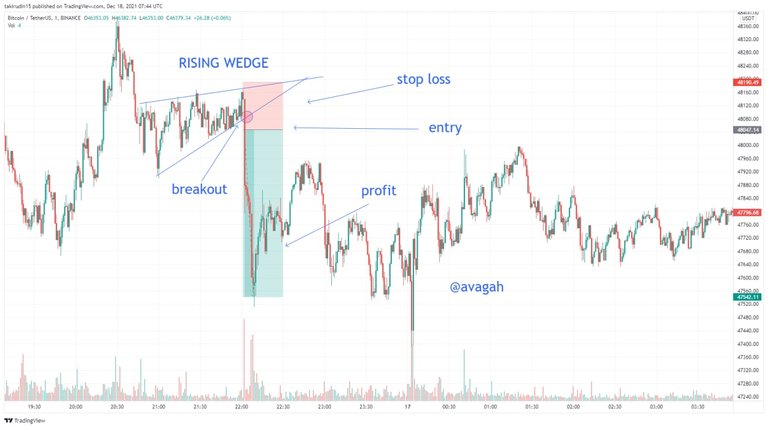
When trading a rising wedge pattern, we seek a good bearish break out as well as a decent entry. BTCUSDT (Bitcoin/TetherUS) is seen in the chart below. On the minute time frame, there is a large rising wedge. With dropping volume, the price reached the resistance trend line four times and the support trend line twice, indicating that it was valid. The best entry occurred soon after the support was broken. This is a good risk-to-reward ratio of 1:4.
Trade for a Falling Wedge
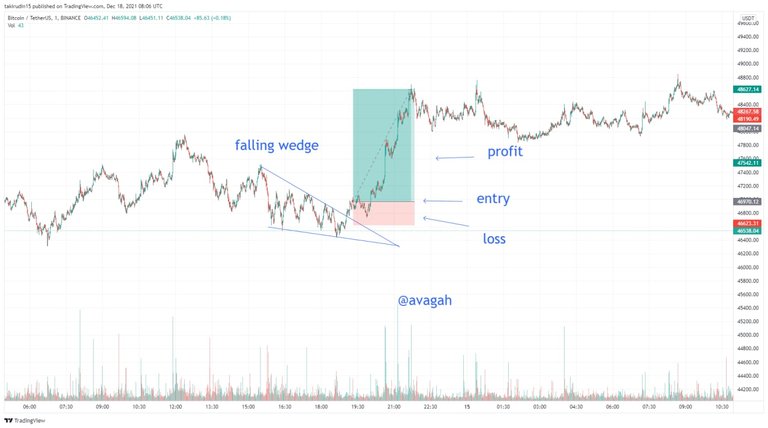
There is a bullish breakout in the case of a falling wedge. The price consolidates downwards, touching the support at least three times and the resistance at least twice, with volume indicating a legitimate falling wedge. The entry is made immediately after the bullish breakout.
The chart below shows a good example of a Falling Wedge. This is a good risk-to-reward ratio of 1:4.
With these trades, The falling and Rising wedge patterns are very good setups for traders to make money considering how easy it is and the risk-to-reward ratio.

Overview of the lesson

Wedge patterns are one of the many trading patterns. When two lines, the resistance and support trend lines, converge at a place, it forms a wedge pattern.
The rising wedge pattern and the falling wedge pattern are the two types of wedge patterns. Rising wedge patterns consolidate up, with a bearish breakout, whereas falling wedge patterns consolidate downwards, with a bullish breakout.
Given how simple the wedge patterns are to use and the risk-to-reward ratio, they will be very helpful.
@solominer my first trading lesson post