Plan
- Monthly
- Weekly
- Daily
- Short term
- Conclusion
- Final word
Monthly
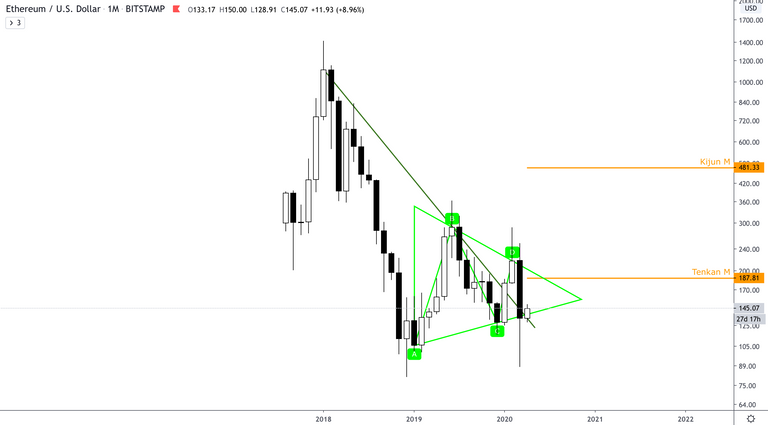
After those last weeks movement it is time to rethink the market and try to anticipate what's coming.
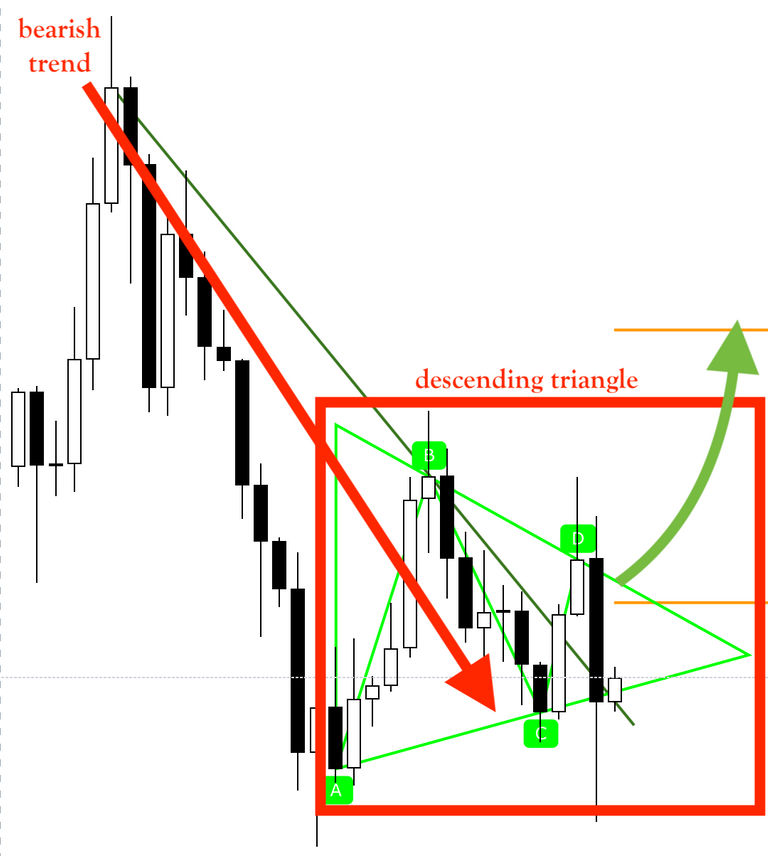
On the monthly basis, price is at the beginning of April retesting the trend line it broke two months ago. At the same time, it is forming a descending triangle which represent a bullish sign after a bearish trend :
Weekly
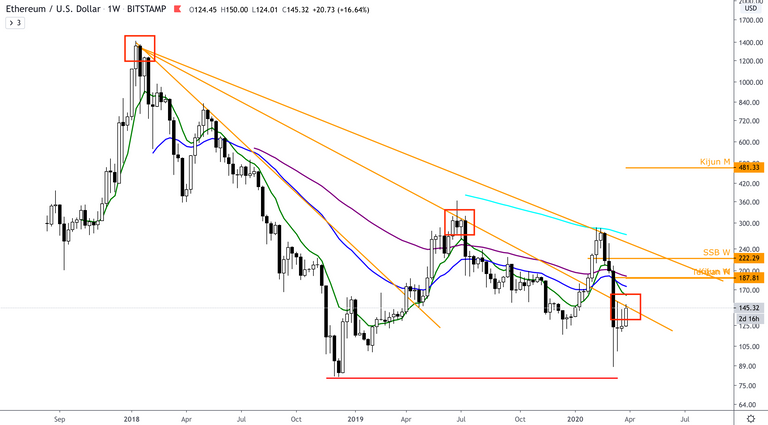
On the weekly time unit, price has come back under the second descending trend line it formed since its very top position. At the moment it is retesting this line, let's see if the price manages to climb above or if it will take another few days to do so.
What is some more interesting is the double bottom recently defined on the extreme prices. I usually prefer to work with closure prices as I already explained it in a previous article, but this time extreme prices have tested this double bottom with closure price regaining terrain and holding much higher. This is actually a sign of a very powerful double bottom if it manages to come to validation level between 315 and 360$.
Daily
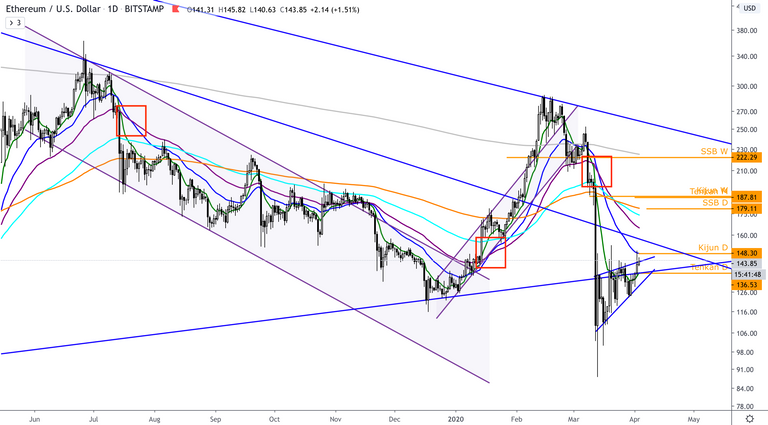
On this time unit we can observe an upward angle formed during the last two weeks, a bearish sign in a bearish movement. It represents mostly a movement consolidation.
Also if we look at EMAs 26 and 25, they've followed the movement very well. Once the price broke both of them, it didn't last long before they crossed each other to confirm a change in the trend. At this very moment the price is slowly approaching EMA 26, but EMA 50 is far above and will be difficult to reach after the recent emotional fall.
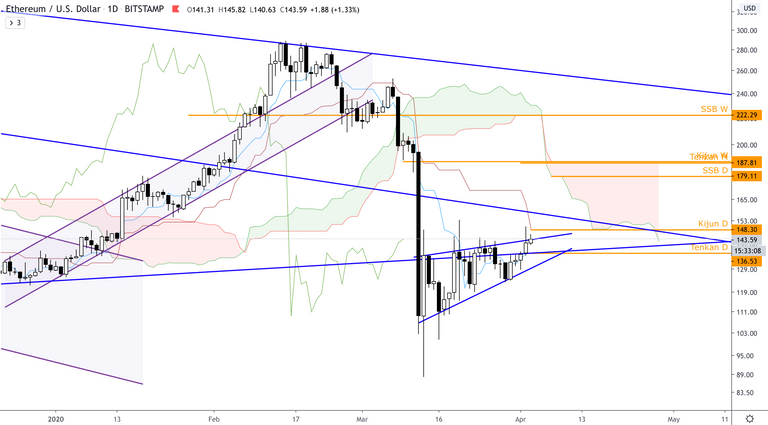
And when we give a look at Ichimoku's lines, we can observe that all of them but one will now act as resistances.
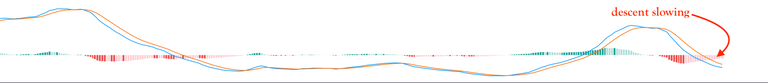
Only my modified MACD shows a possible end of fall and reversal possibilities :
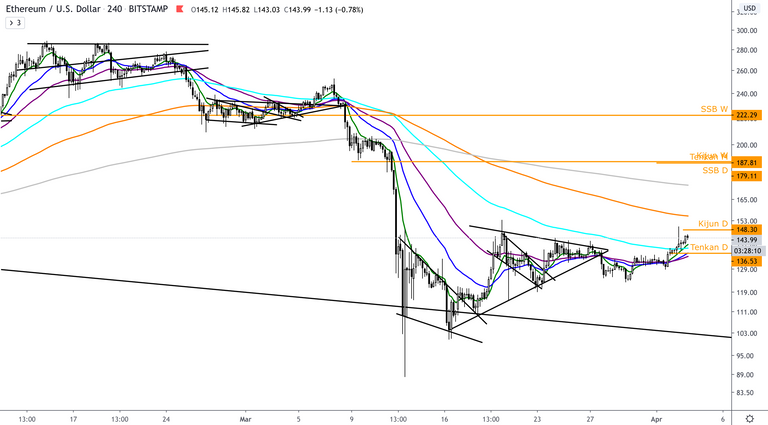
Short term
However, on shorter terms it looks like the price has been stabilising its position and is now evolving above resistances as the following graphs shows :
4h - EMAs
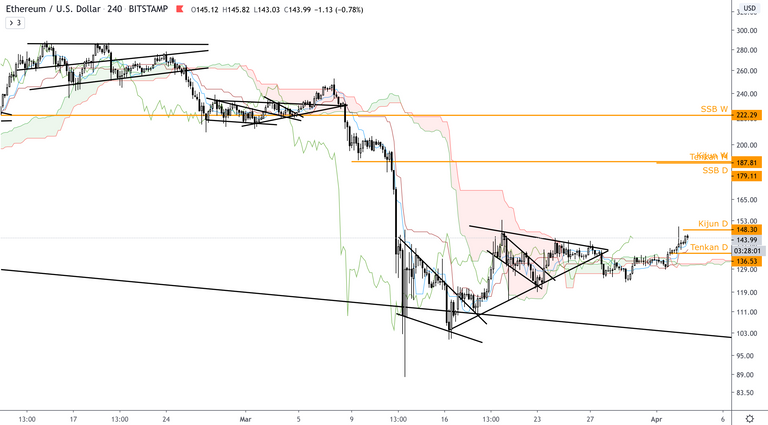
4h - Ichimoku
30min
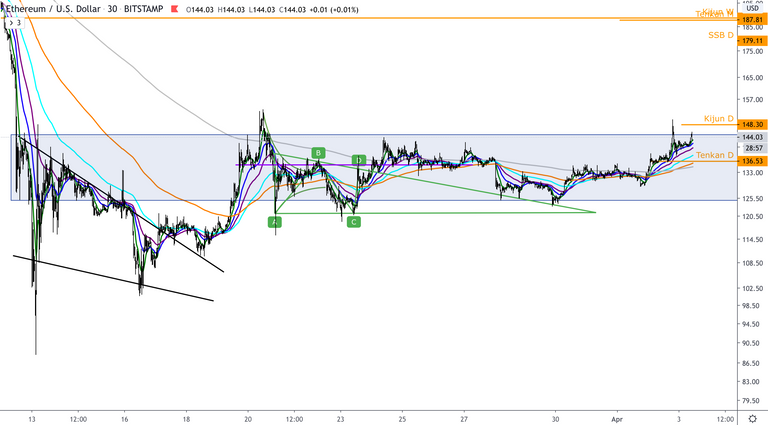
Conclusion
What we can see are two different trends. The long term and the very short term shows bullish signs. But middle term (daily) shows more bearish signs, even if you take a look at modified MACD that could come to a stabilisation and reversal. So here comes two strategies :
- You wait for the daily trend to reverse to be sure the movement comes fully positive before investing. This could be a very good plan to limit the risks.
Safe buy price : 190$ if the price closes above SSB daily on Ichimoku
- You invest now assuming the long term will now slowly take the lead as it already did in gold and then you take position on a very low cost ETH today.
Stop loss : 115$ and if prices closes there it should be wise to wait for a new fall and reinvest as this level is very important in the weekly double bottom.
Final word
Last week was a little overloaded at work. I'm behind on my articles and must correct that. I must apologise for this. In the next days will come two articles :
- Gold miners - Is the crisis over on their side ? [Update].
This article's goal is to keep anyone up-to-date on my favourite mines I recently shared.
- 5 Gold miners on which you want to keep an eye.
As I promised in my last article, I will share with you some coming opportunities int the gold miners world that you don't want to miss.
Stay updated threw the different channel :
- Telegram channel
- Twitter where are shared my articles, those from my coworkers and other article I find very interesting
You can also join the Crypto/GoldLeoSwitzerland's discord. This project is quite new but if you're interested into precious metals' analysis or DeFi it would be a pleasure to count you among our investors ! For more informations you can read this article : Major moves forward for CryptoSwitzerland and GoldLeoSwitzerland