Markets had a sideways week but the upwards momentum for the month did push quite a few covered calls to assignment - timing is fine by me as it raises cash for new investing opportunities. Did allocate some of my house proceeds into ASX stocks through a low cost investing platform

Portfolio News
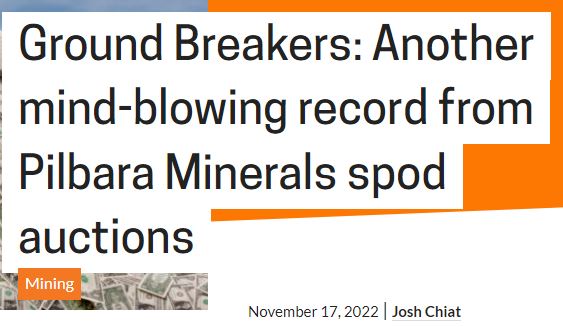
In a week where S&P 500 dropped 0.62% and Europe dropped 0.63%, my pension portfolio dropped a bigger 1.08%. Biggest drags were Australian resources, especially Pilbara Minerals (PLS.AX) down 11.4%. This was a surprise fall given the week's headline
Also dragging were alternate energy stocks in US and Asia - lithium, battery power and uranium.
Big movers of the week were Arafura Rare Earths (ARU.AX) (+29.6%), Clear Secure (YOU) (+16.9%), Cobalt Blue Holdings (COB.AX) (+15.8%), Centrica plc (CNA.L) (+13%), Starr Peak Mining (STE.V) (+12.5%), Bayhorse Silver (BHS.V) (+11.1%), First Solar (FSLR) (+10.8%), Nordic American Tankers (NAT) (+10.7%).
A small list of movers in a quiet week with Arafura rising on deal news, Clear Secure being pushed by AAPlus, Centrica on Europe gas moves and Canadian silver mining contributing two to the list.
Mogul Games Group (MGG.AX) did go up 100% but that does not count as any move up from $0.001 starts at 100%
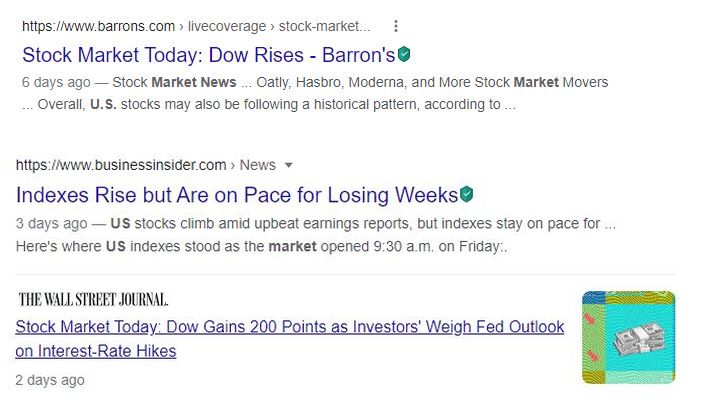
The headlines are quiet which tells me the market was quiet - a down week with a little bit up on the last day.
Someone at Forex Factory is suggesting for the start of this new week that inflation has peaked
The thesis - demand is slowing as Covid stimulus has been spent and real wages are falling; supply chain problems are easing meaning supply can improve and moeny is tightenining. Makes sense to me - we shall see if it plays into the inflation numbers.
https://blog.commonwealth.com/independent-market-observer/inflation-has-peaked
US Solar
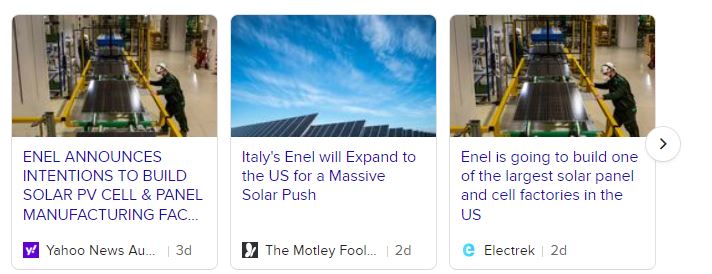
Enel SpA (ENEL.MI) announced it will be building a huge US-based solar facility - not just a solar farm but also an integrated manufacturing facility.
Maybe that announcement helped the First Solar price to pop as it has a fair amount of US-based manufacturing.
Crypto Drifts
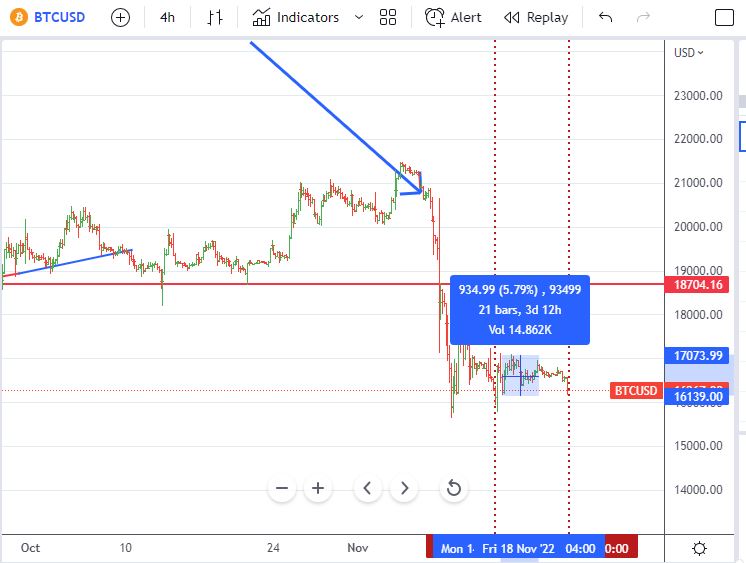
People ask if crypto is dead or if it will come back. The week's price action on Bitcoin holds clues with the range from peak to trough only 5.79%. That suggests the big selling has been done. The bad news is price ended the week at the trough level = no buyers yet but holding above $16k
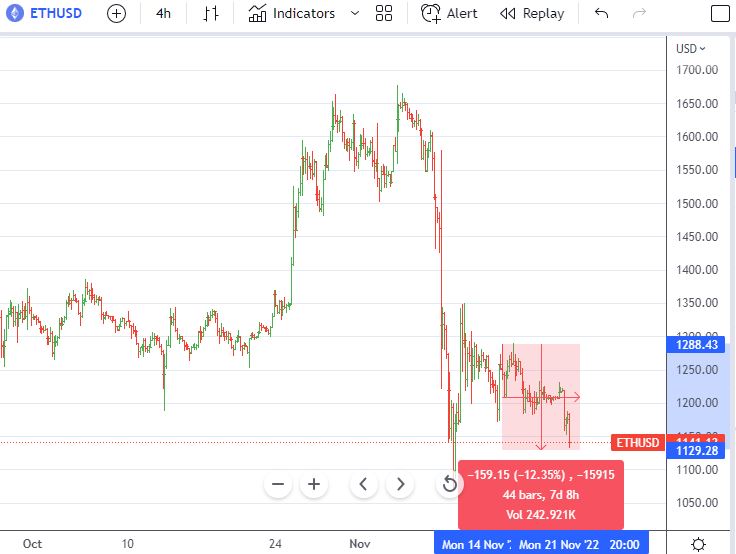
Less happy is the Ethereum chart with a range more than double and price still dropping.
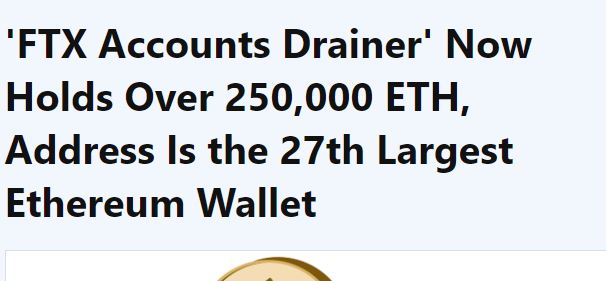
There are some large ETH balances on the move - suggestions is they might be the funds hacked from FTX.
This stash of ETH coins is going to overhang the market - just like the Bitcoin from Mt Gox collapse and also those seized from Silk Road. The holders are always going to be net sellers.
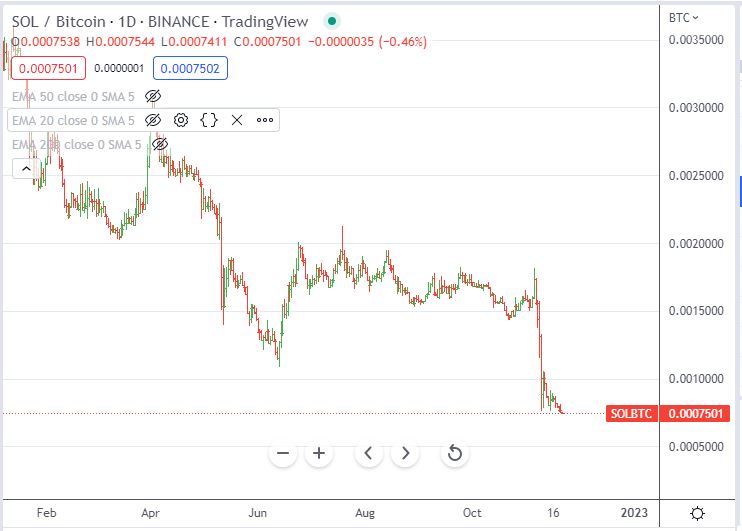
Even Solana may have found a bottom with price matching the bottom of the big fall and not falling further. Wishful thinking more likely
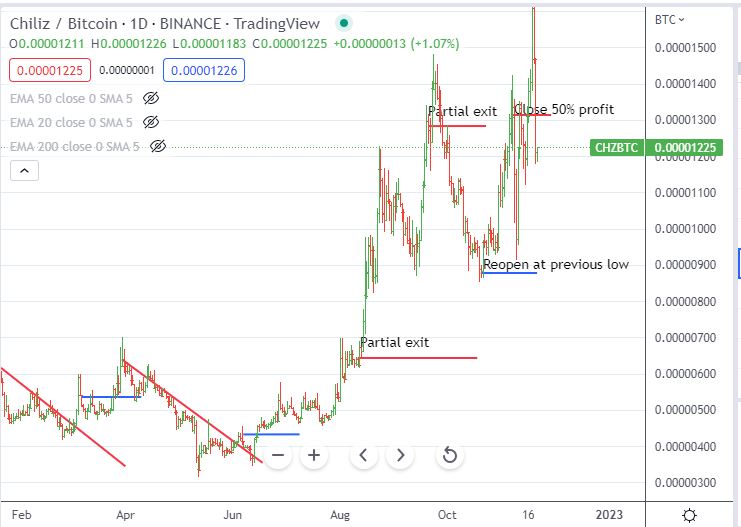
Chiliz (CHZBTC) founds some buyers on its spiky path - not surprising as the Football World Cup 2022 is on us.
Bought
Australian Stocks
I funded my Sharesies account last week with a view to building up a portfolio of ASX stocks based on contrarian investing principles. With the ASX slated to follow the US markets up in Monday trade, Monday was a good time to start. Three step process
- Run stock screens in Tradingview. I use Price to Book < 1; Price to Sales < 2 and Price earnings < 10. Technical factors are 20 day moving average is higher than 50 day and 50 is below 200 and price makes a one month high. So I am looking for stocks that are undervalued on some metric buy are showing signs of turning up.
- List the stocks identified and note down dividend yield and price earnings. This is more interest sake but it could highlight red flags - e.g., unsustainable dividend yield; dividend yield not backed by earnings; stuff like that
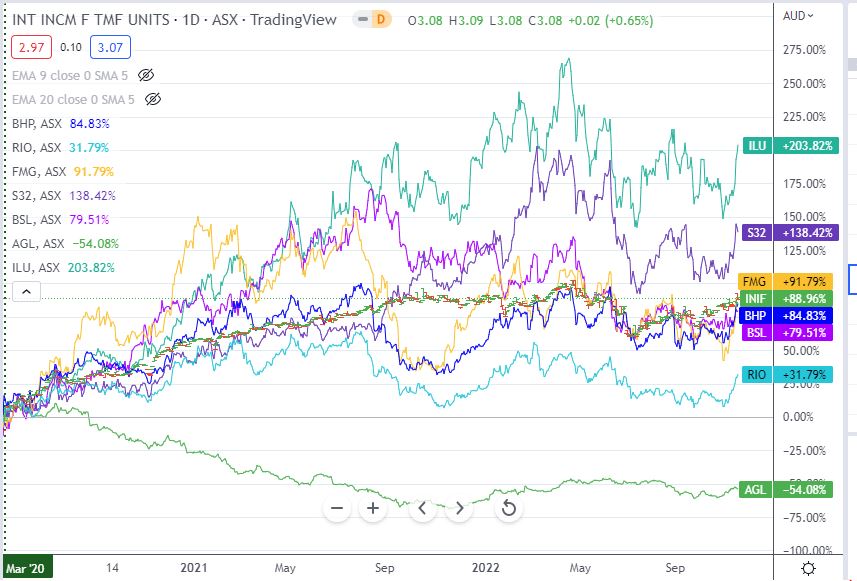
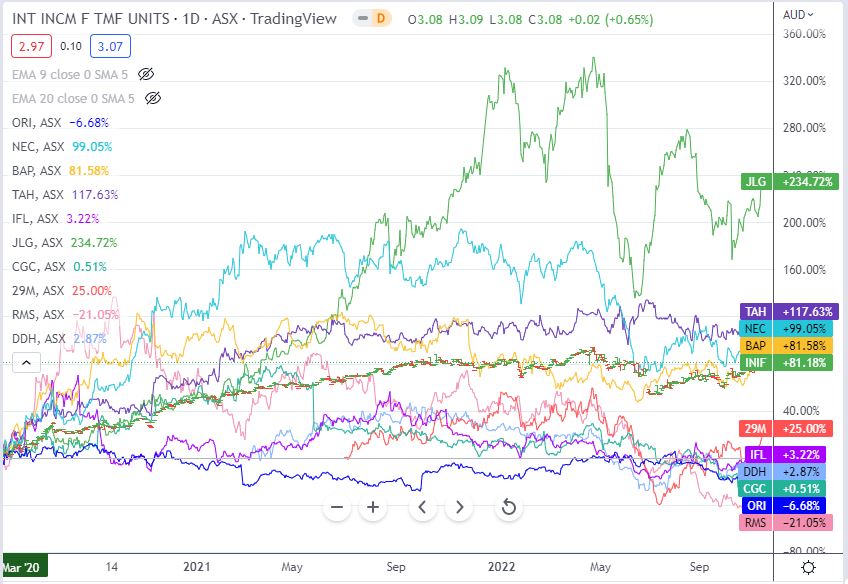
- Compare all the stocks from one screen (in this case price to sales and price to earnings) to an ASX ETF. I used Intelligent Investor Australian Equity Income ETF (INIF.AX) as it is a stock I am holding in my portfolios and represents a balanced income growth perspective and went back to the Covid-19 lows from March 2020. Use this screen to select all the stocks that are under-performing the ETF.
Price to Earnings screen
Price to Sales screen - no Price to Book candidates
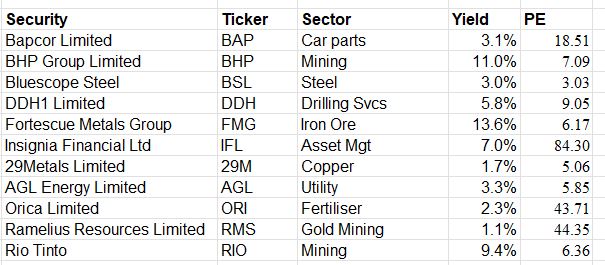
I bought equal size holdings of $200 each in the following stocks
The sectors are somewhat mixed through there are 3 big iron ore plays (BHP, RIO, FMG). All stocks do pay dividends with a range of yield from 1% to over 13%. The real contrarian calls are those with high PEs - that is contrarian investing for you
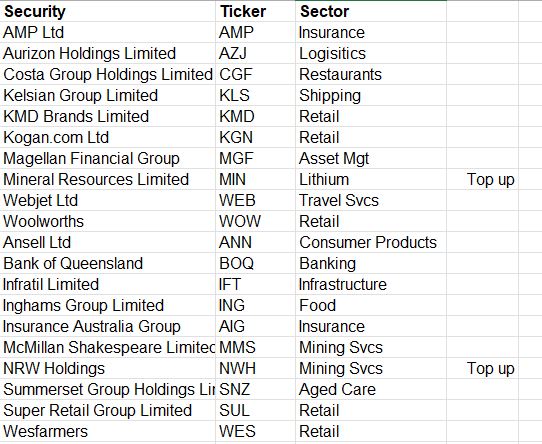
I already have a portfolio which I set up in April 2022 and added to in August 2022 in which holdings were started at $100. For those that were less than $100 in value, I added $100. For those that were above $100, I rounded up to $200 (labelled top up). This was not what my investing coach would talk about - he would back the winners and cut the losers.
This is the list of those stocks with the sectors - a bit more repesentative of the wider economy.
Not sure what the strategy will be going forward. Maybe do this once a month with say $500 extra and rebalance based on winners and losers. I did not invest the whole $5000 - will add a few and lock in the winners
Sold
*Acceleron Industries (ACLN.SW): Europe Industrials. Pending order hit at 52 week high for 20.9% blended profit since September/October 2022. This turbine maker was spun off from ABB Ltd (ABBN.SW). As I can write options on ABB and not ACLN, I would rather hold that.
Long list of stocks assigned on covered calls. The mix shows European markets, especially financials showing signs of life. I will use this as an indicator as to which stocks to replace and which ones to say thanks to the market for finding an exit point 10% higher than the month before.
ABB Ltd (ABBN.SW): Europe Industrials. 3.8% profit since August 2022.
ABN AMRO Bank N.V. (ABN.AS): Dutch Bank. 0.5% blended profit since September 2022
Deutsche Bank AG (DBK.DE): German Bank. 10.8% blended profit since September 2022
ING Groep (INGA.AS): Dutch Bank. 5.4% blended loss since April/July/August/September 2022. Averaging down did help to reduce the loss
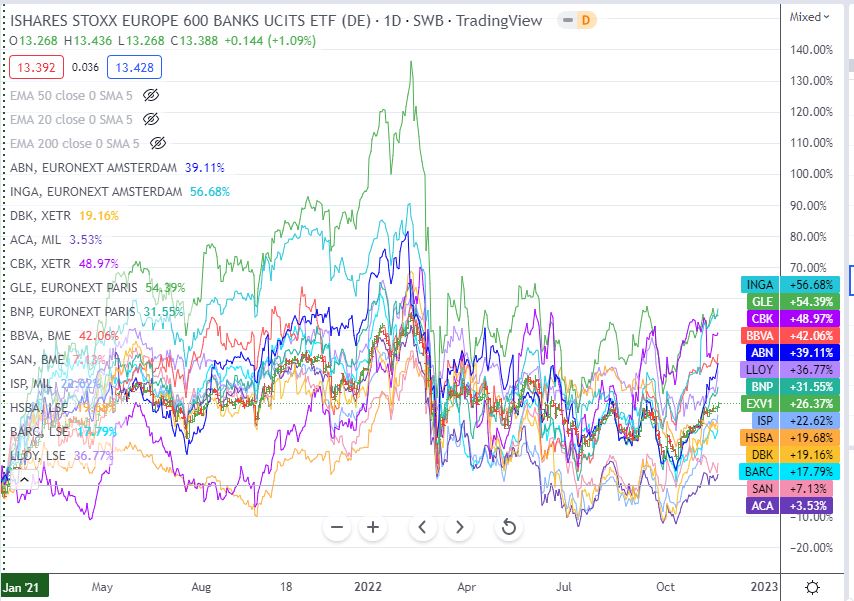
I have plotted these 3 banks against a Eurostoxx Banks ETF (EXV1.DE - the bars) going back to the cycle high in February 2022. The whole sector is down 18% and Deutsche Bank is down more than the sector. Maybe that is the one to replace. The fact that price on EXV1.DE has just made a higher high may suggests it is time to do some bull call spreads across the sector
ENGIE SA (ENGI.PA): French Utility. 7.7% profit since September 2022
Deutsche Lufthansa AG (LHA.DE): German Airline. 2.5% blended profit since January/February 2022. Given the fist tranche was bought not long before the Ukraine War started, I am pleasantly surprised to see a profit. Averaging down in February after the war began did help.
Randstad NV (RAND.AS): Europe HR Services. 8.2% blended profit since April/June/November 2022.
Centrica plc (CNA.L): UK Utility. 11.7% blended loss since July/August/September 2022. This is a story of writing covered calls a bit tight as all three tranches were bought at prices lower than the £0.93 closing price (Nov 18).
Yamana Gold (AUY): Gold Mining. 4.4% blended loss since June 2021/May/September 2022. With the possible takeover by Gold Fields, I have not decided which gold mining stock to hold as a hedge. I like Yamana as it is a low price stock and options market is very liquid
iShares MSCI Emerging Markets ETF (EEM): Emerging Markets Index. 25.9% blended loss since June/December 2021. This was a reopening trade that did not work out.
iShares MSCI Italy ETF (EWI): Italy Index. 7% blended loss since December 2021/July 2022. Averaging down did help but not enough. Trade idea was to follow the appointment of Mario Draghi as PM - well he did not last that long. See TIB576 here
TechnipFMC plc (FTI): Oil Services. 19.6% profit since September 2022.
KraneShares CSI China Internet ETF (KWEB): China Internet. 35.8% blended loss since August/September 2021/April/October 2022. This is just plain ugly and shows the price of investing in a market that is over-regulated and never free.
Nordic American Tankers Limited (NAT): Oil Shipping. 10.5% blended loss since October 2020/February/March 2021. Accounted for this on FIFO basis - the last tranche has an appreciably lower cost base and would be a profitable allocation
Posco (PKX): Korean Steel. 9.2% blended loss since March/August 2022. This was a lithium play which I will reinvest in.
NVIDIA Corporation (NVDA): US Semiconductors. 38% loss since April 2022. Income trades did recover 27% of the capital loss.
Sunpower Corp (SPWR): Solar Power. 15% blended loss since August 2022 - 3 tranches of which one was bought below $23.21 close (Nov 18). Solar power is a key long term theme - just seems troubled with the flip-flops on policy at Federal and State level (especially California)
Shorts
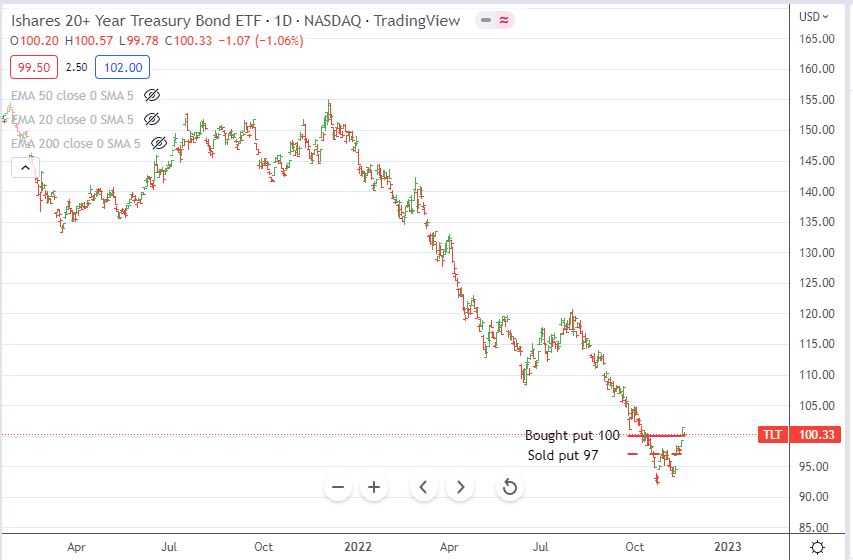
iShares 20+ Year Treasury Bond ETF (TLT): US Treasuries. With price trading at $100.30, I sold the bought leg of 100/97 bear put spread expiring this Friday. I do not expect price will drop 3% in one session - so I left the 97 strike sold put as a naked put. Trade sold at 85% loss not taking into account the sold premium.
Quick update of the chart shows the bought put as a red ray and the sold put as a dotted red ray. I paid the price for not watching the trade more closely as it was highly profitable in the middle two weeks - should have locked in the profits and rolled it down and out then.
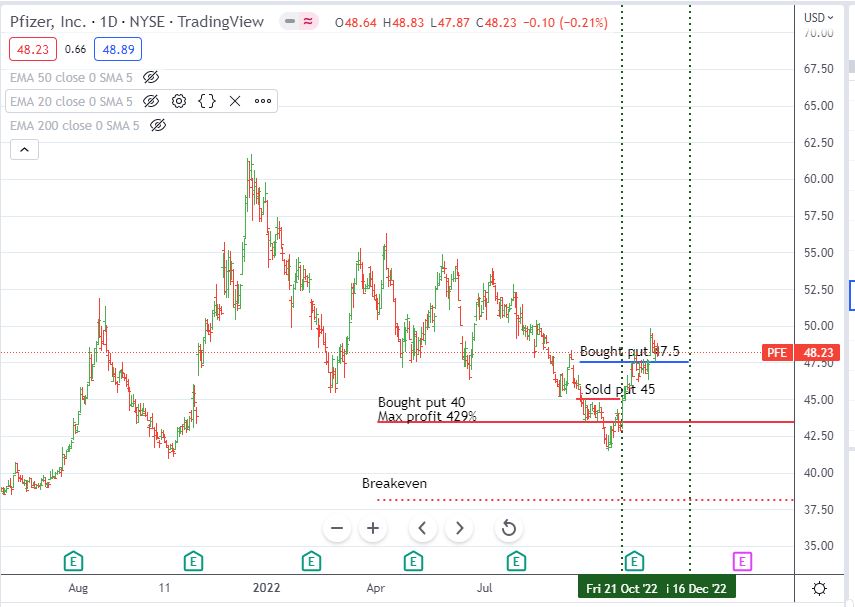
Pfizer Inc (PFE): US Pharmaceuticals. With price closing at $48.23, 47.5 strike long put bought in August 2022 expired worthless. Disappointing as price was below $47.50 last week - I missed the chance to roll it out in time. A sad case of taking the eye off the ball as until this expiry the overall trade started in March was working profitably.
The chart update shows price breaking above the bought put in the last few days. Longer term short trade is looking sick but it is structured as a cash neutral ratio put spread.
Cryptocurrency
No trades
Income Trades
Was a quiet month for covered calls as I only wrote in one portfolio for November expiry. In all 49 covered calls written (UK 2 Europe 13 US 34) of which 16 were assigned (UK 1 Europe 7 US 9)
Did write 10 December expiry covered calls in managed portfolios to start the process missed last month (UK 1 Europe 7 US 2)
Naked Puts
Aegon N.V (AGN.AS): Dutch/US Insurance. With price opening at €4.71, wrote a December expiry 4.6 strike naked put to fund almost all the shortfall in net premium on the December expiry 5.5/7 call spread. 3rd quarter results posted two days ago do not post a rosy picture for the call spread to go in-the-money.
Deutsche Bank AG (DBK.DE): German Bank. Kicked the can down the road on 10.8 strike naked put in a cash positive trade. Locks in 65% profit on the buy back. I am not ready to be assigned at that price - high for the week was €10.43 = getting close.
Credit Spreads
I added a few December expiry credit spreads on stocks that AAPlus keep talking about
AMN Healthcare Services, Inc. (AMN): US Aged Care - ROI 19.8%
Vulcan Materials Company (VMC): US Building Materials - ROI 21.2%
Clear Secure, Inc. (YOU) US Software - ROI 49.3%
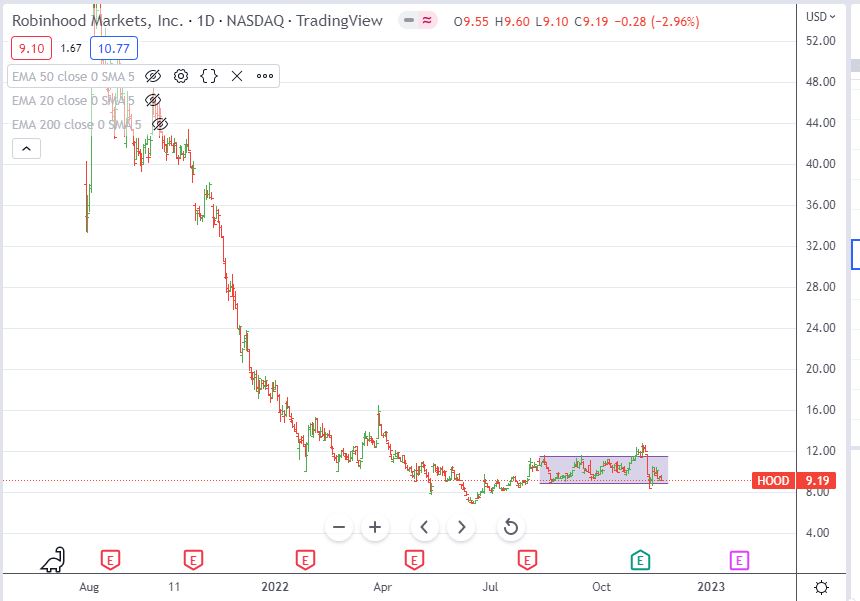
Robinhood Markets (HOOD): Financial Markets. TTB loss on 11/10 credit spread. The chart shows price trading in quite a tight band for the last 4 months with a spike above and below in the last 4 weeks. Maybe the way to trade this is to write nake puts below the channel as there is a lot of resistance below that.
Cautions: This is not financial advice. You need to consider your own financial position and take your own advice before you follow any of my ideas
Images: I own the rights to use and edit the Buy Sell image. News headlines come from Google Search. All other images are created using my various trading and charting platforms. They are all my own work
Tickers: I monitor my portfolios using Yahoo Finance. The ticker symbols used are Yahoo Finance tickers. Crypto tickers come from TradingView
Charts: http://mymark.mx/TradingView - this is a free charting package. I have a Pro subscription to get access to real time forex prices
Investing: Interactive Brokers provides comprehensive global markets coverage with very competitive commissions. Open an account to earn up to USD 1,000 in IBKR stock. https://mclnks.com/ibkr
Crypto Trading: Binance offers a wide range of coins to trade, tight spreads and low fees if you use BNB to pay https://mymark.mx/Binance
Kucoin offers a wider range of altcoins than many of the other exchanges. I do like to diversify my holdings in case an exchange gets knocked over. Grab 15% discount on your trades when you open an account on this link https://mclnks.com/kucoin15
Tracking: Keeping track of your crypto trades is a whole lot easier with CoinTracking.info. Get 10% off all your account upgrades https://mymark.mx/CoinTracking
November 14-18, 2022
Posted Using LeoFinance Beta

I do love reading your updates. Some of its over my head but it’s all about the learning opportunity.
Thanks. I write them up as a discipline to learn from the wins and the losses. It also gives me a journal that is searchable. Just search for tib (my unique tag) and the topic or the ticker and I can easily find what I was thinking at the time
Was thinking today about going back to emailing the updates.