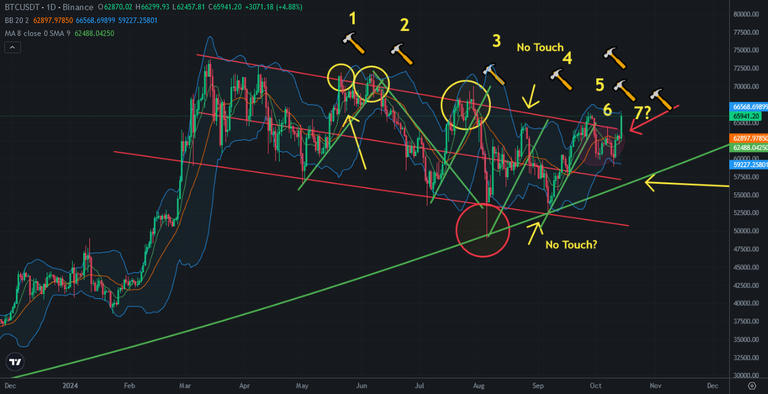
We have seen 6 bullish traps on Bitcoin price chart in this year. Bitcoin may break up great resistance and It may not be a bullish trap. We may enter mega bullish trend if it happens..
I shared lots of analysis about Bitcoin price chart. I showed you possible bullish traps. They worked as well. Today Bitcoin price broke up descending channel with huge volume and hype. It may not be a bullish trap. It may be the beginning of bullrun and mega altcoin season.
Here you can see daily chart of Bitcoin. After touching 59K, Bitcoin price went up fast and touched 66K where is at great resistance. Today Bitcoin price is trying to break it up and enter bullish trend.
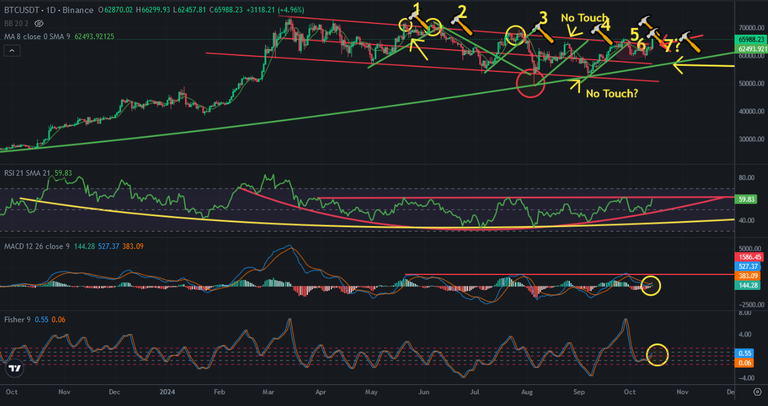
Here you can see the indicators of daily Bitcoin price chart. MACD Indicator reversed from the bottom. Fisher Indicator also reversed from the bottom. MACD should break up great resistance level..
There is also great resistance on RSI Indicator. It should be broken up!
These will be the proof of entering mega bullish trend. If not, we may see again bullish trap.
I think Bitcoin may break up these resistances.
I will follow the indicators. I was out of market. It is not too late to flow the cash to market.
We will see..
Posted Using InLeo Alpha
So we are not going back, to get another opportunity !!! Was waiting for another..