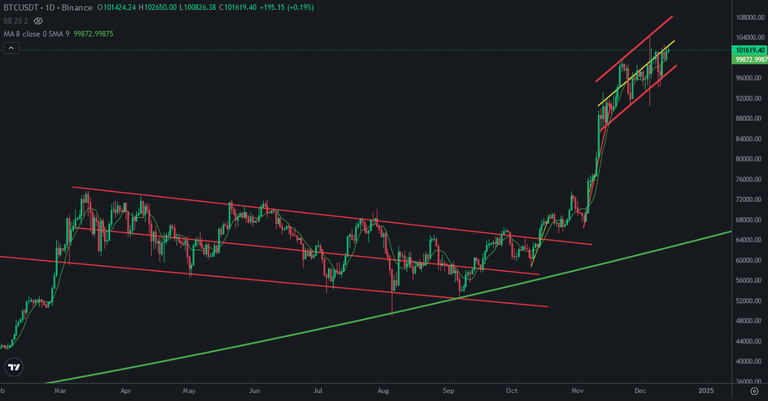
There is ascending channel on Bitcoin price chart. We have seen a few bearish traps on Bitcoin price chart. Even Bitcoin broke down the bottom line of this asvending channel, price went up into this channel. Even there are good news for Bitcoin and crypto market, Bitcoin price can not break up the middle line of this channel.
Here you can see daily chart of Bitcoin. There are two price channel on Bitcoin price chart in this year. The middle lines of these channels worked as resistance and support. It is one of major resistance on Bitcoin price chart during asdending channel. So, Bitcoin should break up and touche the top line of this channel to continue bullish run but It is very hard to see in this year!
I shared a few analysis about possible price correction on Bitcoin price chart and we are so close to this price move..
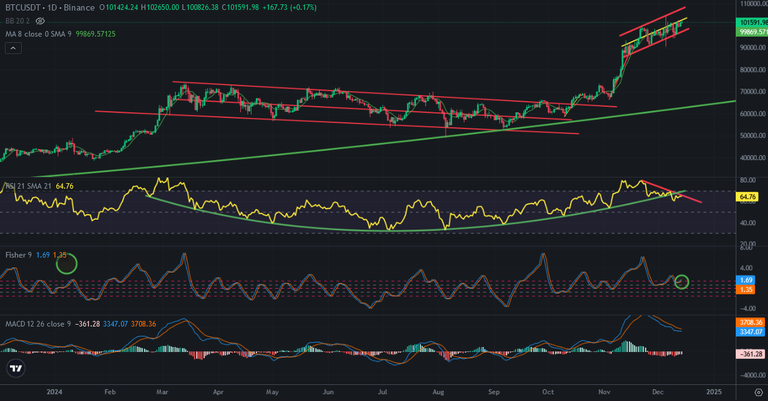
Here you can see the indicators on daily Bitcoin price chart. There was a big great bowl pattern on RSI Indicator. It is broken down a few days ago!
There is also negative divergence on RSI Indicator. There are 3 tops on RSI Indicator. Even they are going down, price is going up. So it is preparation for price correction.
Fisher Indicator is also at high level. It should reverse down.
MACD Indicator is at correction...
These are major reasons that we will see price correction.
There is also downtrend line on RSI Indicator. Bitcoin may touch this downtrend line in a few days. After touching this resistance, we will see price correction on Bitcoin price chart..
I shared weekly price chart analysis for Bitcoin yesterday. I showed you possible bearish trend on market. If price correction starts on daily price chart of Bitcoin, we will enter midterm price correction on weekly chart of Bitcoin.
Lots of good news released. Bad news comes at the bottom. Good news comes at the top.
Market maker wants you not to sell your cryptos before price correction.
We will see.
Posted Using InLeo Alpha

