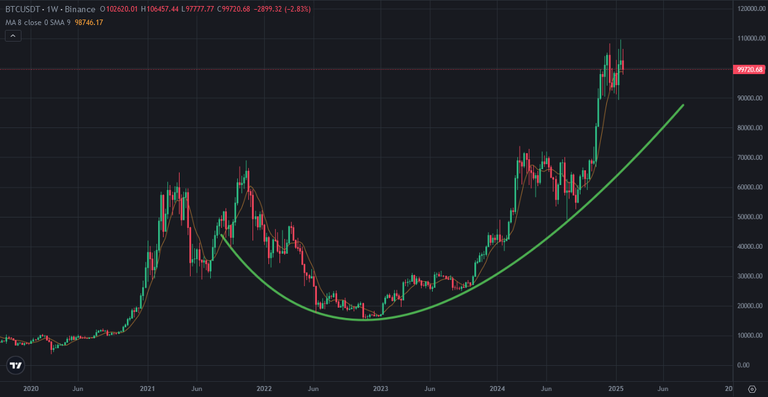
Bitcoin price can not brek up all time high. Even there are lots of good new for crypto market, Bitcoin price broke down 100K USD. It started to seem bearish for midterm. Here you can see weekly chart of Bitcoin. Even Bitcoin price look bullish for longterm, It need price correction for term. There is mega bowl pattern on Bitcoin price chart. Price is far away from the support line. Bitcoin price may want to touch to be supported by this line..
Possible level to touch this pattern is at 8x USD. Bitcoin price may enter price correction to be supported by this pattern.
Here you can see the indicators on weekly chart of Bitcoin. MACD Indicator is on the top and close to reverse down. Fisher Indicator is on the top and reveresed down, still going down. You can see what happened after reversing down on MACD Indicator.
IF MACD Indicator reverses down, we may see price correction on Bitcoin price chart for midterm. It may take a few weeks. We may see price correction until Summer.
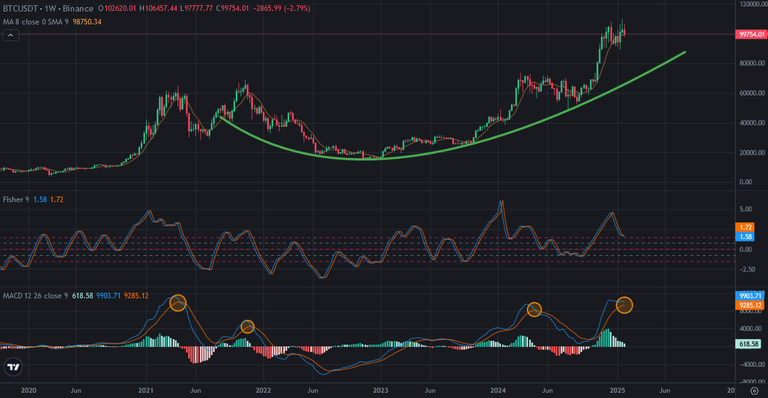
It is so possible to see price correction on Bitcoin price chart of rmidterm. All of indicators are on the top. They need to see correction.
We may see the proof of price correction on Bitcoin price chart in a few weeks.
We will see..
Posted Using INLEO
I hope we could back again above 100k
Congratulations @chorock! You have completed the following achievement on the Hive blockchain And have been rewarded with New badge(s)
You can view your badges on your board and compare yourself to others in the Ranking
If you no longer want to receive notifications, reply to this comment with the word
STOPCheck out our last posts: