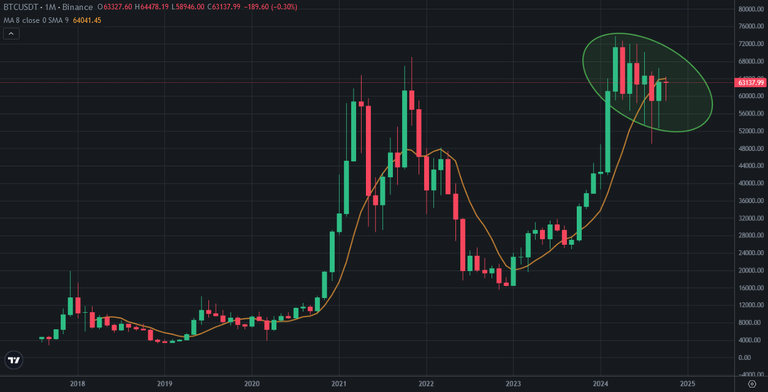
There are consecutive monthly candles on Bitcoin price chart. Bitcoin has 4 green and 4 red monthly candles in last 8 months! This is 8th month from the beginning on consecutive candles. This is the red monthly candle's month! Will we red candle in Uptober?
Here you can see monthly chart of Bitcoin. Bitcoin price is below 8-month moving average. It is important for longterm trend. You can see what happened after going down this moving average. Bitcoin is trying to go above 8-month moving average to enter bullish trend for longterm.
8-month moving average is getting horizantal as 2020. Its means may be a correction before bullrun. So, Uptober may be red candle for Bitcoin price chart.
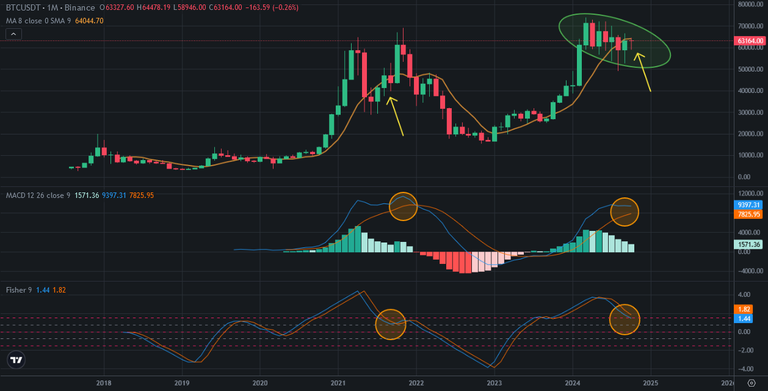
Here you can see the indicators on monthly chart of Bitcoin. There are lots of similarities between 2021 and now. MACD Indicator is trying to reverse from the top. If it happens, we will enter mega bearish trend. We will pass altcoin season and enter longterm bearish trend as 2022.
Fisher Indicator is also at the same level as 2021. Fisher Indicator is trying to reverse for bullish direction. We should see green candles on monthly Bitcoin price chart not to enter bearish trend.
2024 US Election will be the decision of Bitcoin. Even Uptover may be red monthly candle, after election we may see a few successive monthly green candles on Bitcoin price chart.
There is no major news to break the Consecutive monthly candles trend on Bitcoin price chart in this month. I think we may see red candle.
We will see..
Posted Using InLeo Alpha