Disclaimer
Ohayou, Longs!
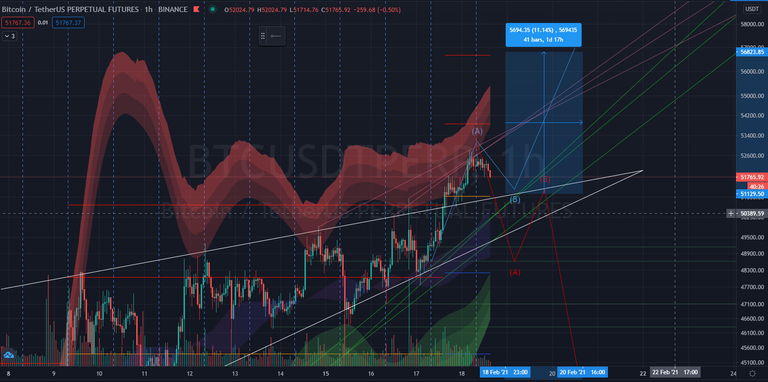
Seeing an obvious rising wedge pattern, (but I havent posted it here, Im sorry) - and now BTC hits 51k, what is next 55k or 60k? In Layman's terms, before this happens, BTC could go down a little bit and test the 50k price level, in which we could actually say that it is because the volume is going down we could possible see a fake out (See Figure 2)
57k would be a possible resistance because some of the long buyers after a 50k/51k will be taking profits, and that means there will be selling going on, and we are measuring it from 51k - 57k price range thats 11.6%. Meaning those who bought with a x8-x10 leverage already gained x2 from their placed margin bet.
Shorties
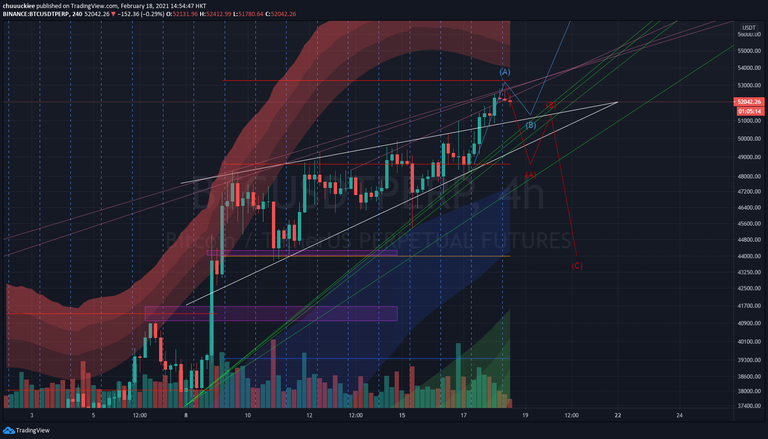
False breakouts are possible in this market, it is normal if Bears are strong then why wouldnt it push going downwards, right? BTC could go down to 44k, and have a fresh start again with another bull trend. This would happen if volume is going down.
BTC Dominance
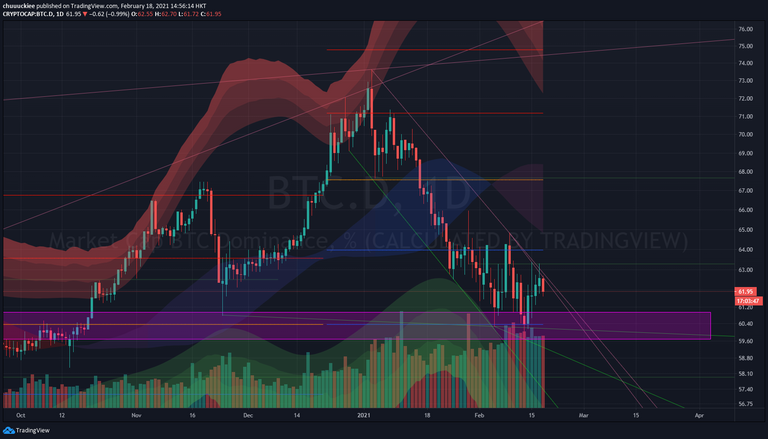
Why should we and would we include this? We are able to determine if Alts will be bleeding incase of BTC's price volatility. But its somewhat hard to anticipate since BTC is going up and we still need to discover new ATHs and secure some levels so we can properly plan if BTC trades sideways.
You can see that the pattern from the start of 2021 BTC Dominance rose about 73%, and going down to 60%. Now you are thinking what did happen along those days then? Traders are buying alts and prices from altcoins and shitcoins are now doubled and some even tripled or quintupled.
Conclusion
Personally, Id HODL main ALTS and BTC for this year because we are still in a bull trend. In futures, its pretty difficult if you are a BTC bias because you are trading in USDT, which however if you are trading other exchanges like BITMEX or maybe BYBIT for example, you have an opportunity to trade with Inverse Perpetuals. I will explain in the next blog because our discord group is increasing day by day.
Index Blog
Starting a Small group to help beginners in Trading
1.x.x - Introduction x Start Trading w/ Binance preferably
1.x.x - Rules of Trading
1.x.x - Calculating and Managing your TradesHIVE
2.2.14 - Is Hive really Bullish? - HIVE/BTC and HIVE/USDTBTC
3.2.18 - BTC Hits 51k, whats next 55k or 60k? Lets see the Charts
3.x.x - Lets All Clarify Elon Musk's Bitcoin Purchase, and what do you think?
Sources/Links/References
Similar Web - Website Traffic Analysis
Trading View - Live Trading Charts
Canva - Free Online Photo Design Editor
Discord Group - Generating
Binance Exchange - Refferal
Trading Indicator 1 - To be Shared
Trading Indicator 2 - To be Shared
Trading Indicator 3 - To be Shared
Posted Using LeoFinance Beta