
Ethereum jumps sharply higher as the market wakes up thanks to Bitcoin, and today to find out where the price is headed I've done this technical and fundamental analysis.
At the time of this writing ETH is trading at $2,285.61, accumulating a loss of 0.80% in the last 24 hours, but holding a gain of 19.57% in the last 7 days.
For some, this cryptocurrency is even in a better position than Bitcoin to accumulate gains in the next rally.
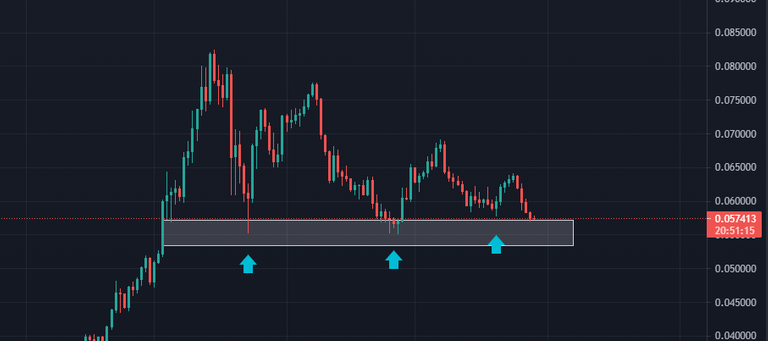
However, we saw again how the ETH/BTC pair declines as Bitcoin shows quite a bit of strength.
Still, it is quite likely that this pair will start a bullish rally soon. For now, it is up to watch the reaction at the big support that the price is currently holding.
The current low rates on the ETH network give it an edge at the moment, where DeFi's are the biggest attraction within the crypto ecosystem, below Bitcoin of course.
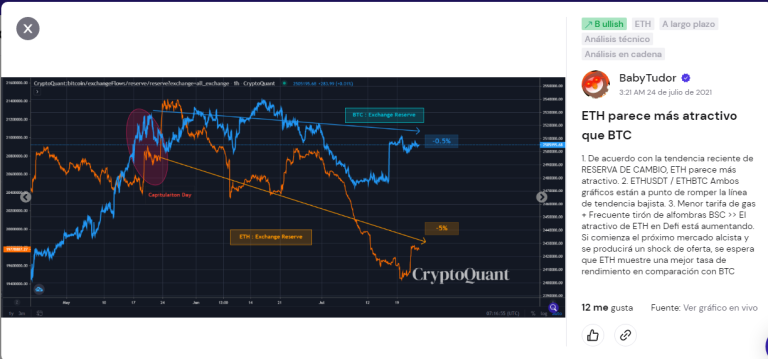
Coin holdings on exchanges decline.
Analyst BabyTudor shows us a graph how the amount of ETH on exchanges has fallen by 5% since the recent peak, reached when the entire crypto market went into a tailspin.
This metric on the Bitcoin network shows a decline of only 0.5%. Despite being a positive sign, it is not as much as it is for Ethereum.
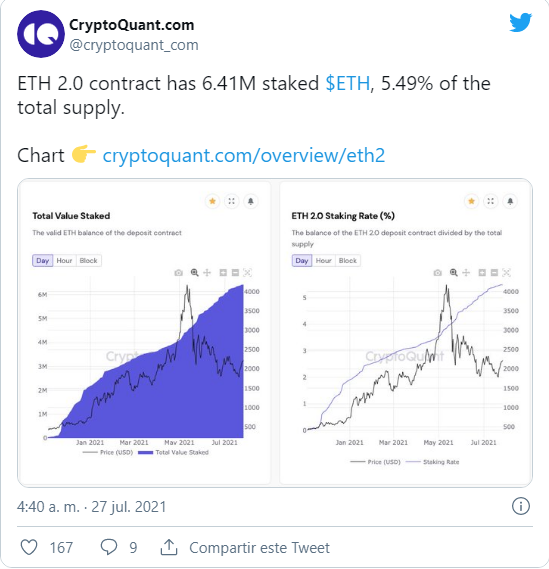
Another good sign is the huge growth of staking coins in ETH 2.0, already meaning 5.49% of the total circulation.
The on-chain data speak of a very good health of this cryptocurrency at the moment. If we add to this the general bullish awakening of the market, I think the scenario is quite clear.
Daily chart
Today from the daily time frame we see a very good performance, as three resistances have been crossed without much trouble, thus creating the beginning of a short term uptrend.
Today the price is being hampered by a resistance at $2,322, and although this may cause some losses in the coming hours, most likely we will only see a simple correction to keep going higher.
If that resistance is broken through, the next target level is at $2,610.

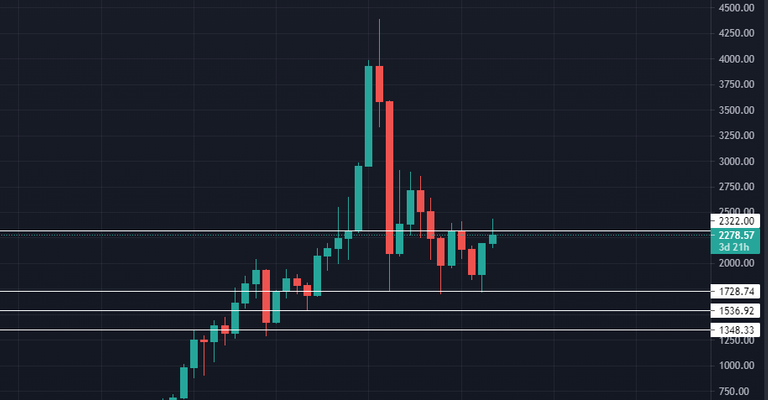
Weekly chart
Making a technical analysis of the weekly chart of Ethereum, we note that the bullish intention has not yet confirmed a major change.
In order to manage to overshadow the bearish strength brought in previous months, the resistance at $2,322 must be broken through, which will mean a resumption of the major uptrend, and the possibility of new all-time highs coming on the way.
For the scenario to be bearish, support at $1,728 must be lost, which would leave the ground clear to $1,536.
This publication is for informational purposes only and should not be relied upon as investment advice.

Posted Using LeoFinance Beta
Congratulations @cryptoday24! You have completed the following achievement on the Hive blockchain and have been rewarded with new badge(s) :
Your next target is to reach 50 upvotes.
You can view your badges on your board and compare yourself to others in the Ranking
If you no longer want to receive notifications, reply to this comment with the word
STOPCheck out the last post from @hivebuzz: