About 3 weeks ago, I wrote a post with a similar title. Back then, the SPY 290 gap was filled and based on my analysis, I thought it will go ahead to fill the other gap at the 300 level.
In the past week or so, the gap at the 300 level is filled and it is probably time to reassess the situation.
--
Looking for reversal signals
I generally think that the fundamentals are still not good. Unemployment is through the roof and there is no clear date as to when we can see a full reopening of the economy. Hence, I am always on the lookout for reversal signals on the charts.
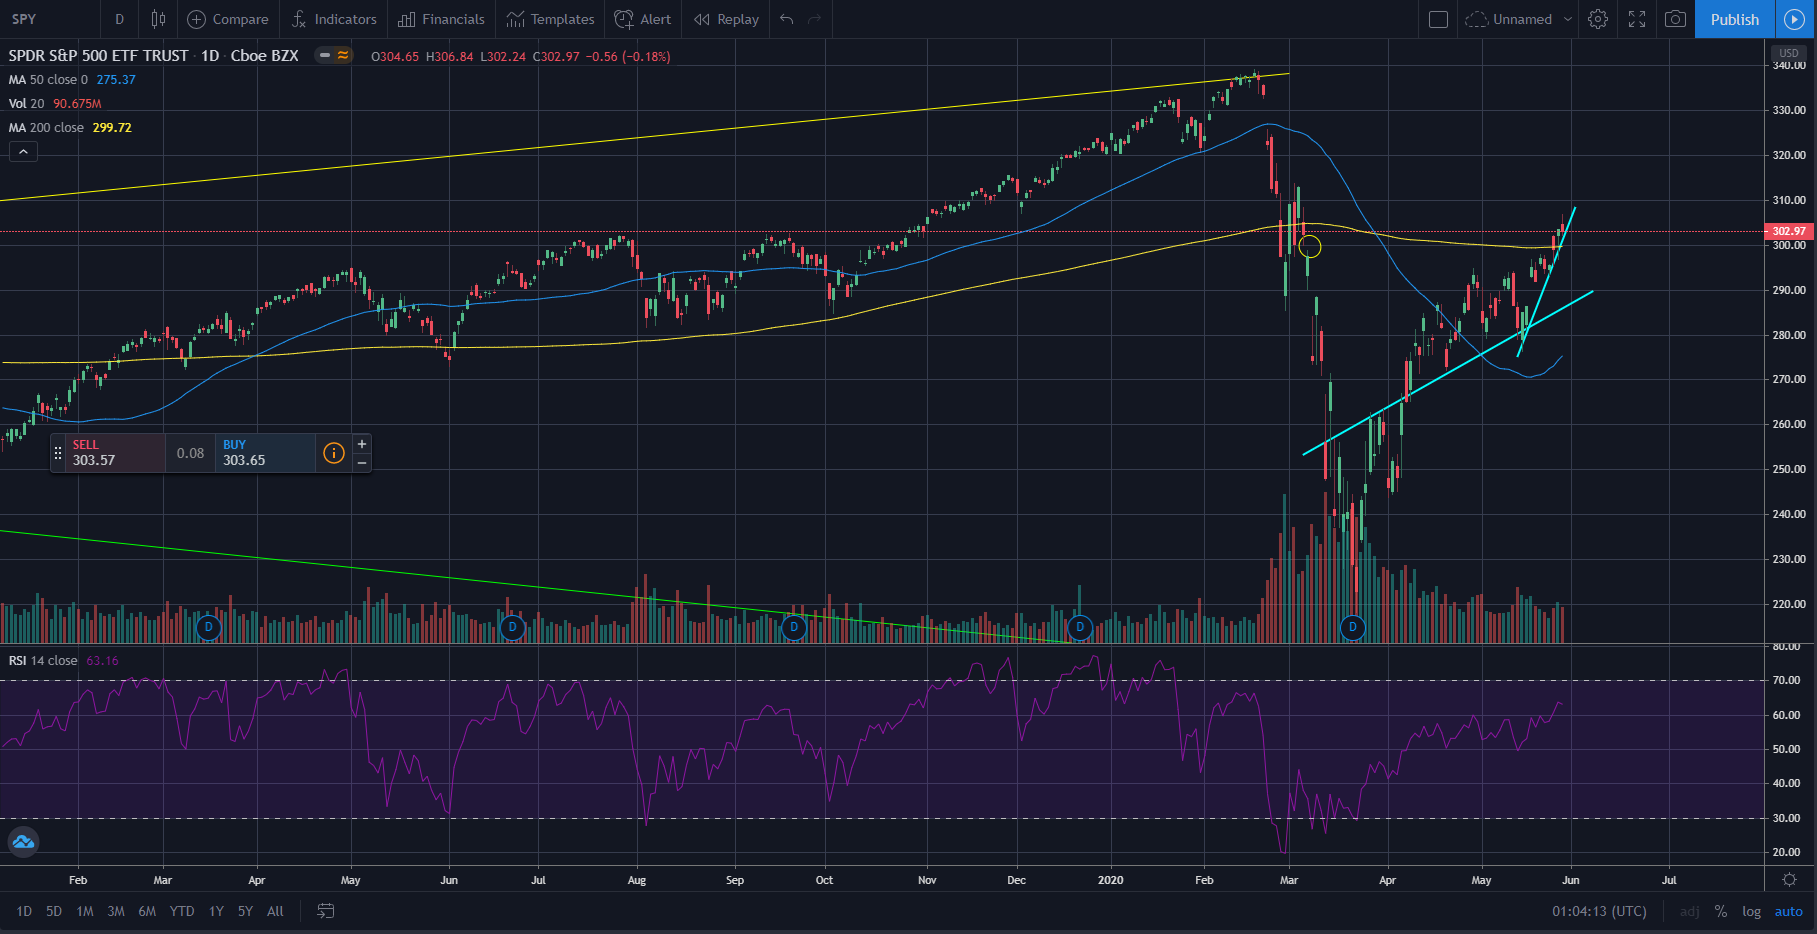
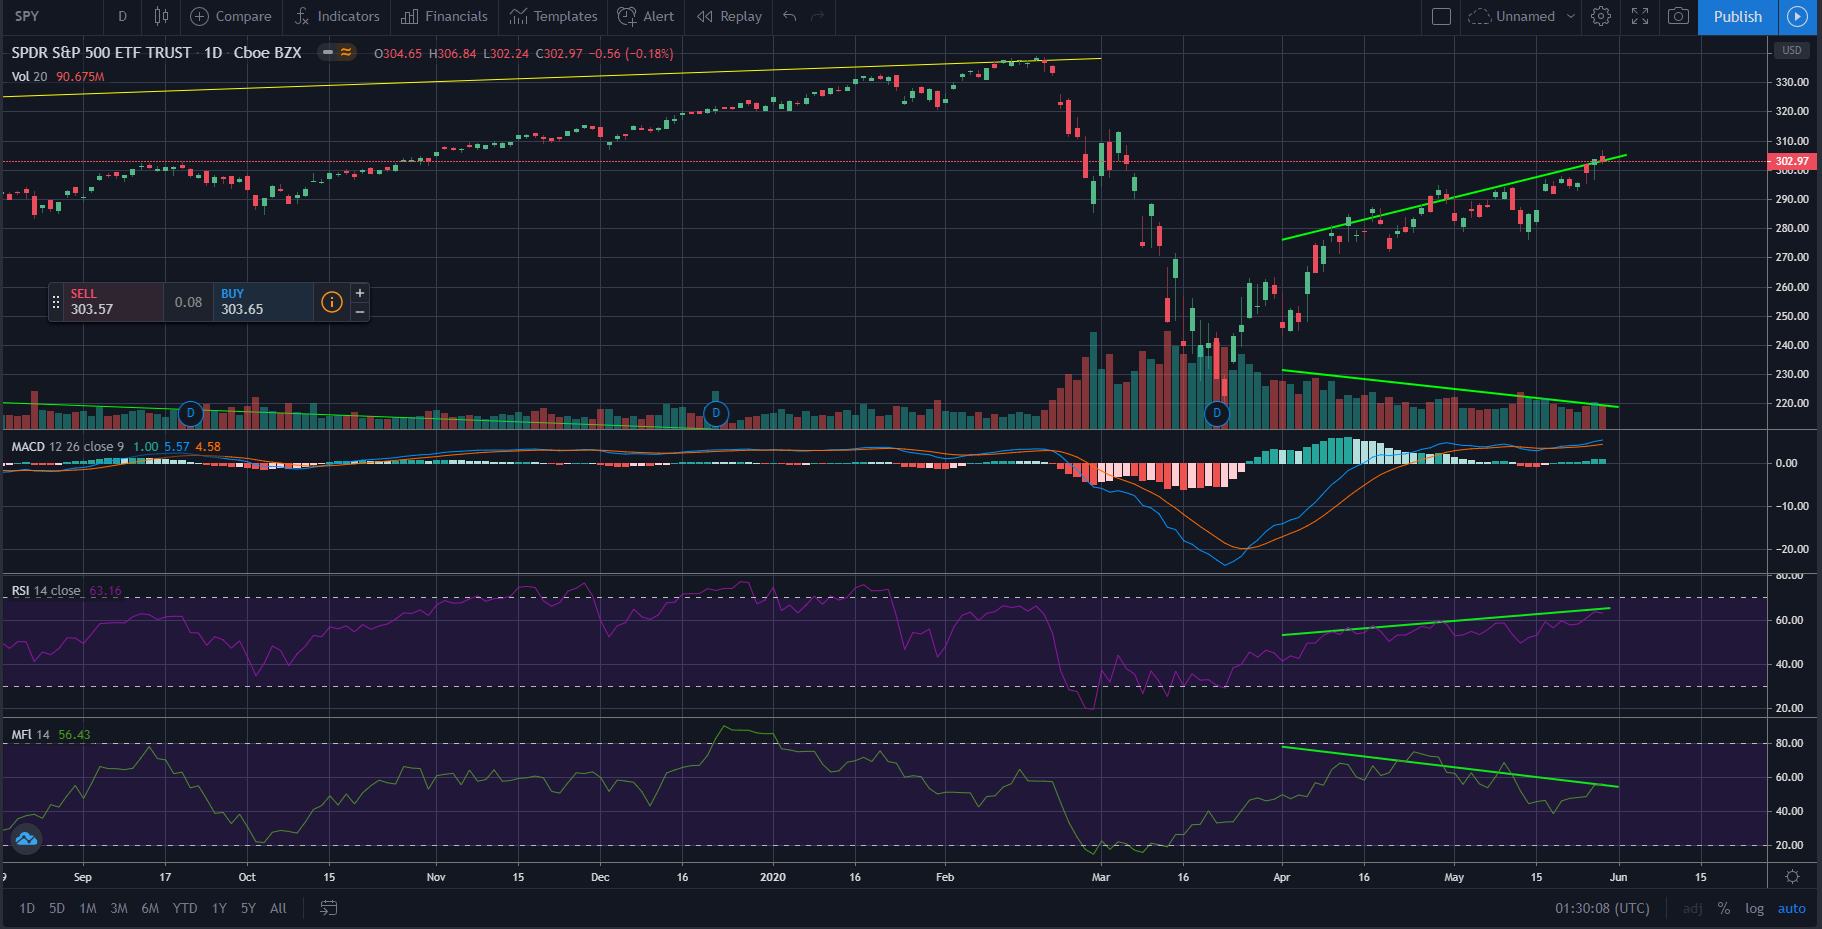
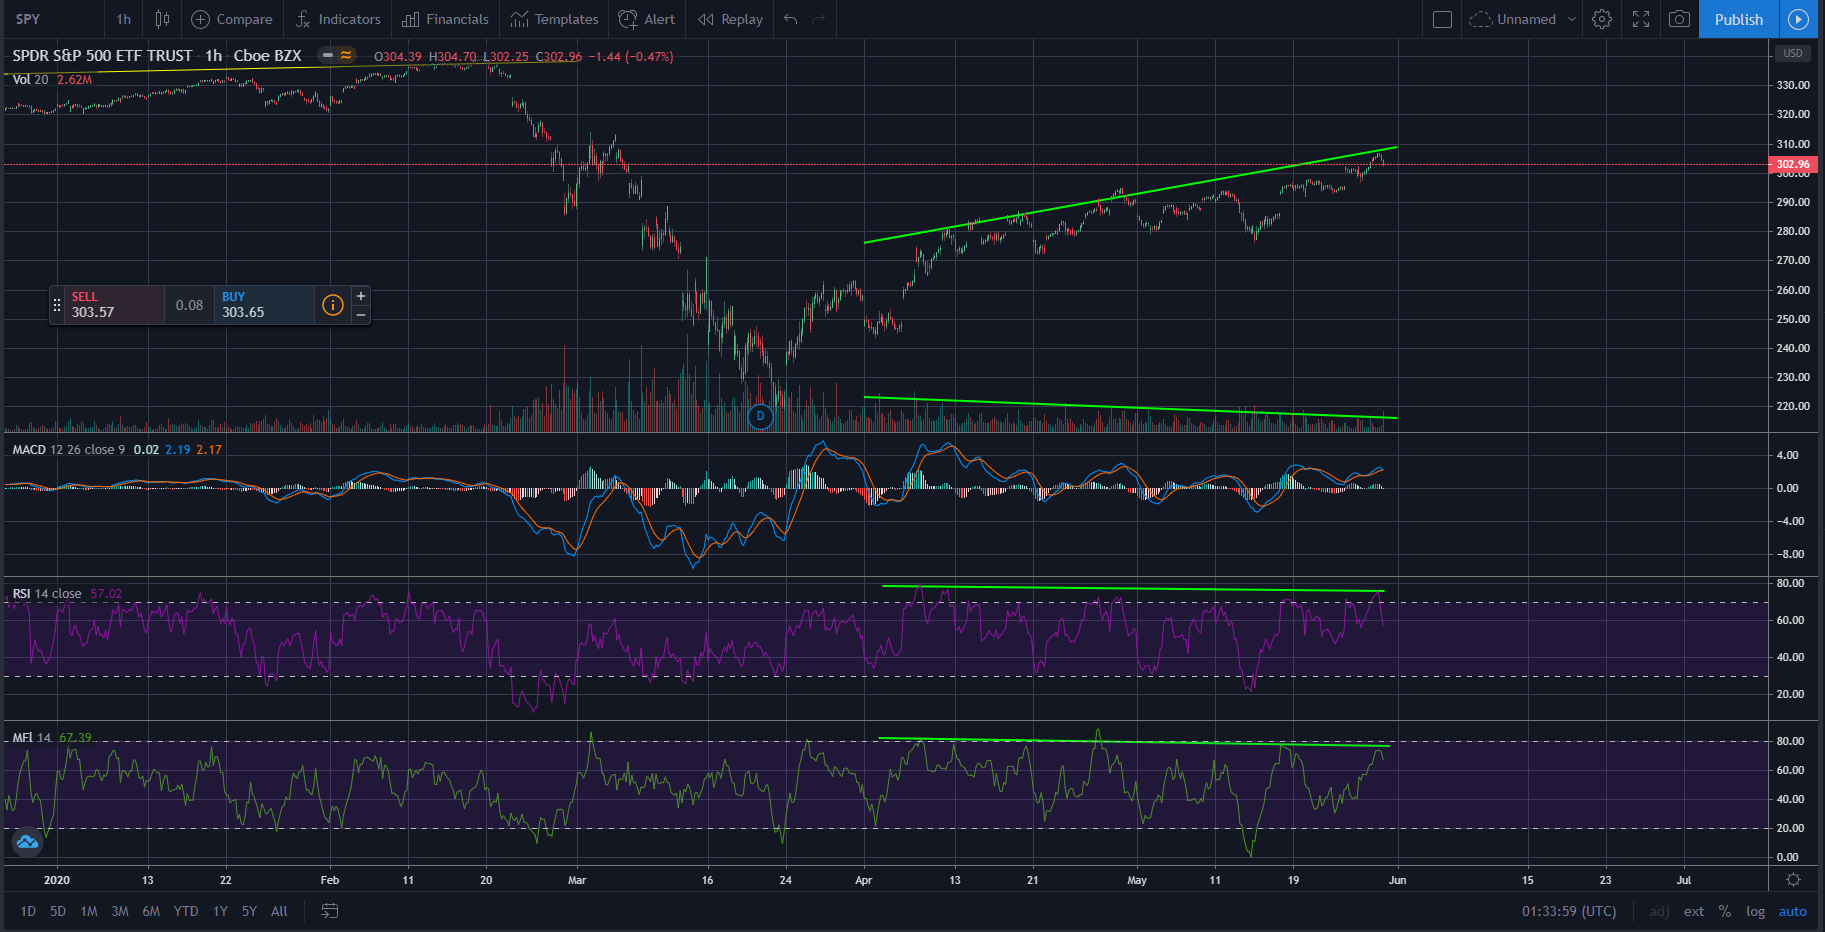
Looking at the chart now, I see that there is a bearish divergence between price and volume. A slight bearish divergence between price and money flow index (MFI). However, note that it has not reach overbought level on the MFI and hence, this may not be a good indicator. As for the RSI, it is normal and there is no divergence.
The MACD is kind of flat at the daily timeframe and nothing much can be derived from it in my opinion.
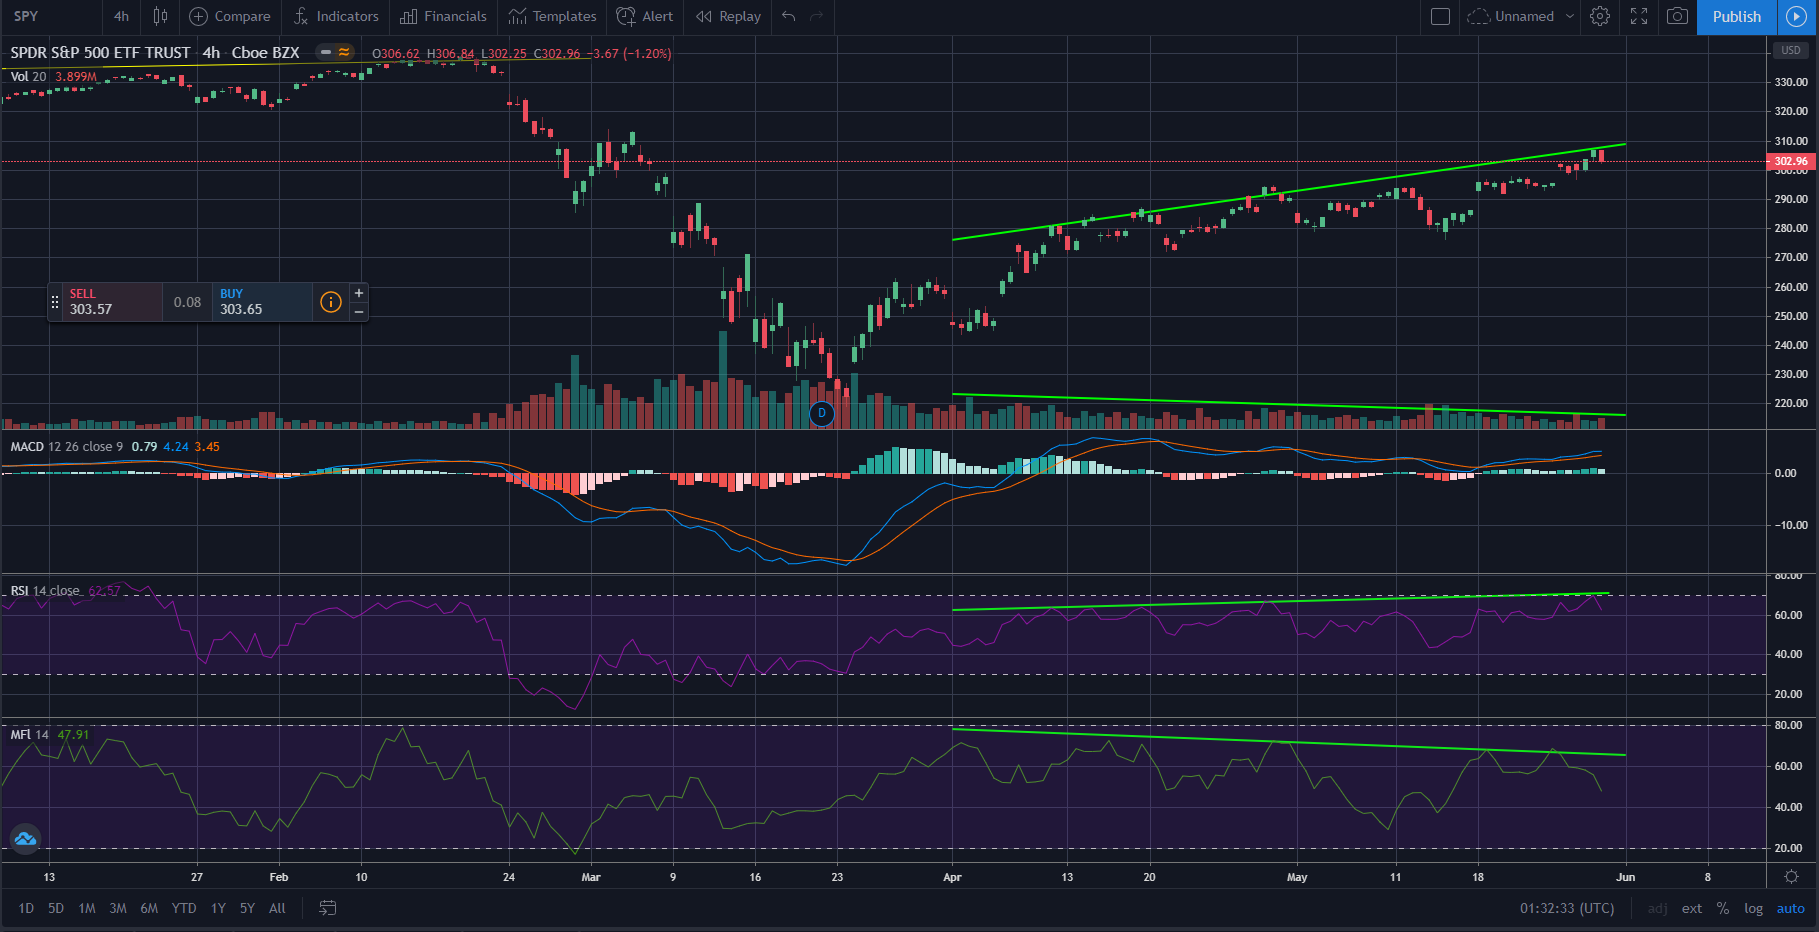
The various indicators are more or less the same on the 4H timeframe and only starts to exhibits reversal sign on the hourly chart. I typically just use the hourly chart for reference and will not trade on them.
Overall, I do not see any clear-cut reversal signals as of now. The RSI, MFI and volume divergences are usually what I use to look for reversals. The MACD is something I use to confirm momentum changes and none of these indicate an immediate reversal. I think there is a fair chance of sideway actions over the next few weeks before a clearer signal can emerge.
Trendlines and moving averages
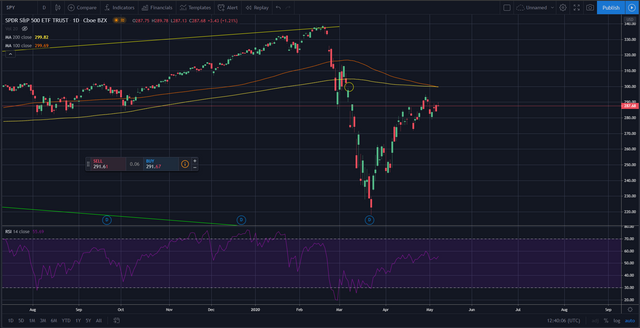
So, lets say if a sudden reversal do take place, where will all the support levels be? This is when I use trendlines and moving averages. When looking at trendlines and moving averages, I like to look at the monthly chart first then zoom in from there. I switched to the SPX chart (actual index chart) as it provides a longer history.
On the monthly chart I see 5 possible points of confluence. I marked them with red circles and numbered them 1 to 5. Note that the numbers are just labels and do not represent specific order.

Point (1)
So if the equities market do reverse, a possible level of support will be the 78.6% fib retracement level which coincides with the 21M SMA and that is point (1) which is around 2880. The 21M SMA is a important level as it serves as the support throughout history and it is only broken when there are major crashes.
In a video from Alessio Rastani, he also mentioned about the 21M EMA being an important level and if there is a fake out above this level the subsequent drop will be tremendous. He called it the "Kiss of Death" sell signal. I am using the SMA instead of the EMA on this chart but I have checked that the monthly 21EMA and 21SMA are about the same right now.
Point (2)
If the 21M SMA fails to support the price, then a drop of larger magnitude is probable. Point (2), the 2630 level, coincides with the 50% fib retracement and the 50M SMA. Also notice that it is the support level of the brief correction during quarter 1 of 2018.
Point (3)
If point (2) fails to hold and the market tanks further in the event of a reversal, then I will look to Point (3). Point (3) is where the long-term upward sloping trendline and the 38.2% fib retracement level coincides. The upward sloping trendline stretches all the way to the last time the market bottomed in 2009. It is also around the 2500 level which is a psychological support level. People generally like round numbers starting with 10s and 5s, e.g. 3000, 2500 and 2000.
Point (4)
Point (4) is an interesting level. If you noticed, I also drew a downward sloping trendline joining the recent lows only using the candle wicks. The fib retracement drawing starts from that low of about 2191. Point (4) is where the 100M SMA coincides with the low. If the price breaches that, it means we are seeing a lower low and the downward sloping trendline will serve as an immediate support in my opinion.
In the event of a lower low, I am looking at the range of 2050 to 2100 level.
Point (5)
Finally Point (5). It is the only level that is above the current price. It coincides with the 1.414 fib extension level and a trendline, marking previous tops, which stretches from August 2011. In a scenario where the equities market do continue to run up, I see a possibility of that level (3430) being hit. Notice that it is also near the all time high.
Conclusion
In short, I do not see any immediate reversal signal yet from the technical standpoint. However, things can change quickly from possible news events. Fundamentally, equities are still overvalued across many measures. But in the short-term, the market is always dominated by sentiments and trends.
Interestingly, there is a possibility of all 5 confluence levels being hit in an unlikely event of an extremely wild swing in the coming months. I doubt that will happen though. Personally, I am taking a cautious stance and looking to take some profits from equities and wait for a clearer signal.
Again, I am just sharing my thought process and please do not take it as financial advice. Due diligence and research are still required for your own investments. In the next part, I will look at trendlines and moving averages on the weekly and daily charts. So stay tuned!
5% goes to @leo.voter to support this amazing project.

Posted Using LeoFinance
Price and Volume still looks very different, but volumes seems like becoming flat.
So I can imagine, the market could be a bit quite for a short while in average and one event will make a trend again. I also can imagine this year something will hit. There are many projects under development right now. Any release will catch the mass eyes back maybe.
Thanks for your amazing well written post 🤗
Thanks for your comment and support!