As we said yesterday (see previous post), bitcoin showed his other side and the bears steped in the market. I think, and we hope for a little. Bitcoin lost about 3k $ in less than 24 hours. But let's be honest guys it's something that we were aware of. The momentum of the price was unexpected and it needs to cool down for a little time to gain some power.
So, today or to be more specific, now, btc is performing into a possible falling wedge in the 15m chart. But the thing that you have to pay attention to, and the thing that I believe is important is the second chart too. Which is the bullish divergence!!
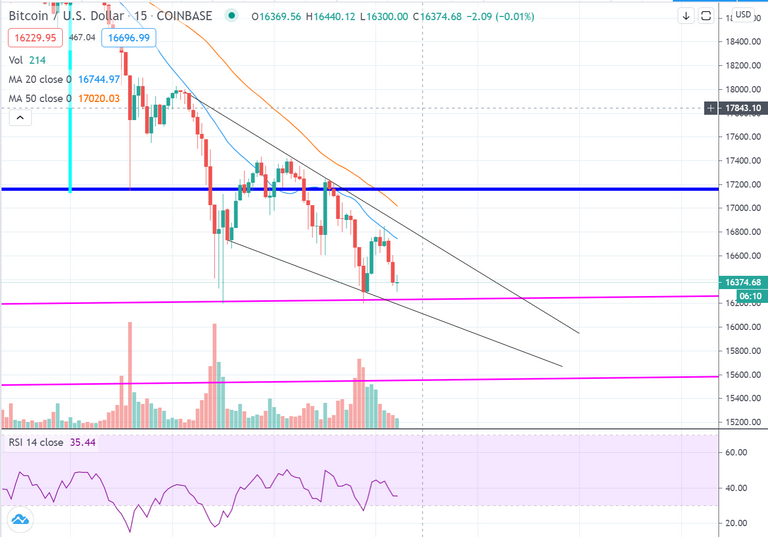
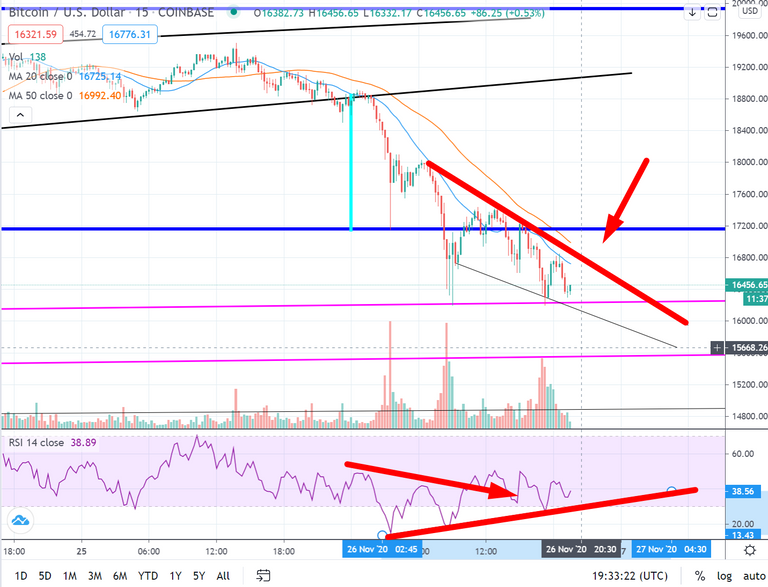
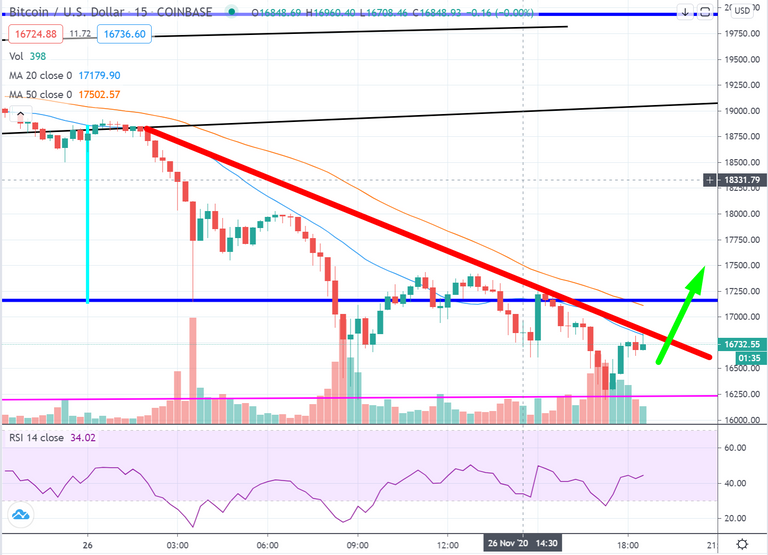
Here, you can see more clear the resistance trendline that is forming and the trendline that needs to break to be in higher levels.
Double bottom signs are always good signs and here they are in the 1h chart!
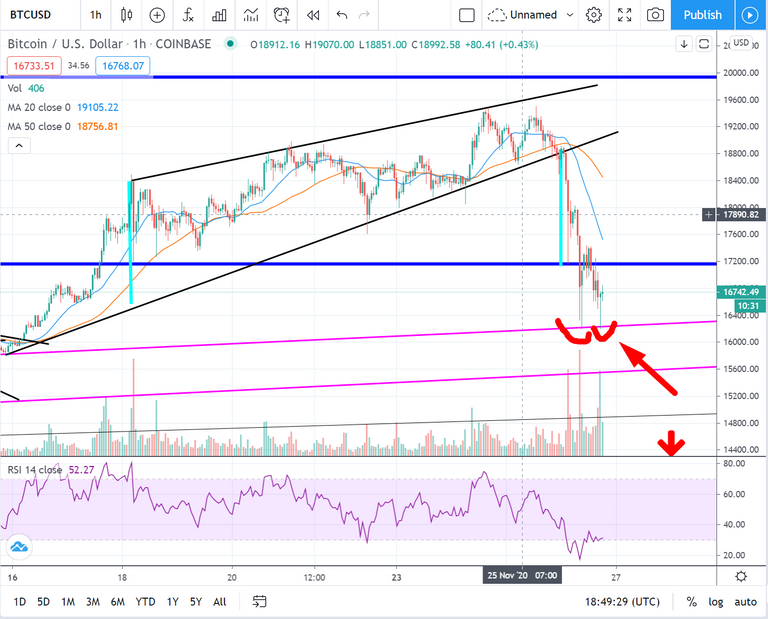
So guys, to sum up don't worry much because this big red line is holding our ground. If it breaks down that trendline maybe it will go in lower price levels.
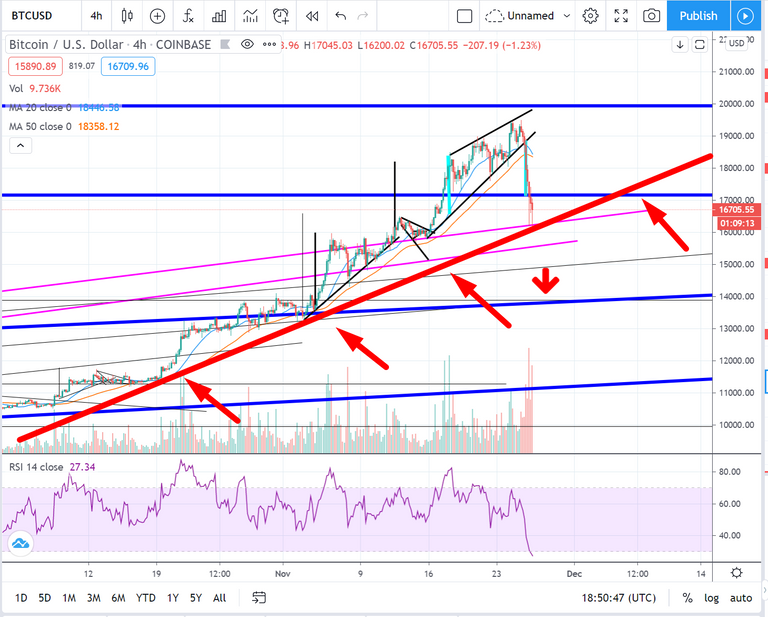
If at least one saw my previous chart and won some $$ it's a win for me!
Take care and always remember. Lower prices now are only opportunities to buy more!
@crypto @bitcoin @dailyleo @news @trading @leofinance
Posted Using LeoFinance Beta