

Wow so we are REALLY cooked huh?
Funny because I still have an active long going (will close soon).
So yeah that happened
Trump is running around playing his little tariff trade war game while seeming to purposefully be manipulating the economy and stock market with it. Maybe that's not the goal but it's hard to ignore the result of these actions.
Personally I'm still pretty convinced that the long game here is to force central banks to lower rates and create a liquidity event for the global economy. AKA: printer go brrrr. With an economy this broken the only thing that can be done to "fix" it is print a bunch of money and position yourself as close to the spigot as possible. The only question that remains is how low we go before the liquidity event happens.
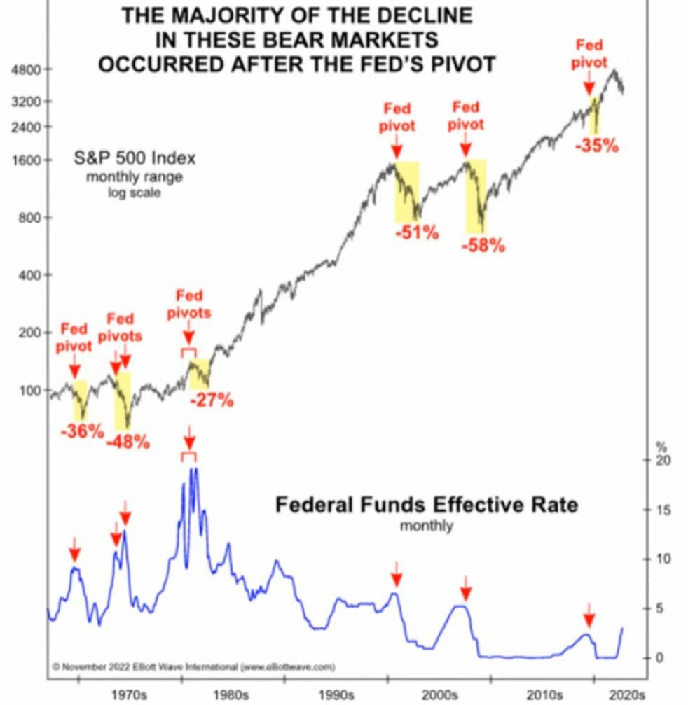
This diagram is from years ago but the message is still the same. It's pretty typical for the bottom of the market to appear at the end of a FED pivot, not the beginning. Everyone was waiting for that mythical pivot but some were pointing out that the bottom isn't in until after it's all said and done.
That being said I just checked the date of that chart and I downloaded it on Wednesday, November 30, 2022... so the price of Bitcoin was literally scraping the bottom at $16k when this argument was trying to be made. FTX had just collapsed. Perhaps the macro cycle of the economy is of little importance to an asset like Bitcoin that moves on a strong 4-year cycle. This is why I'm not too worried about these recession threats that have been going around. Listening to these people back then: you'd already be down an x5 in opportunity cost alone, even at this lower price point.

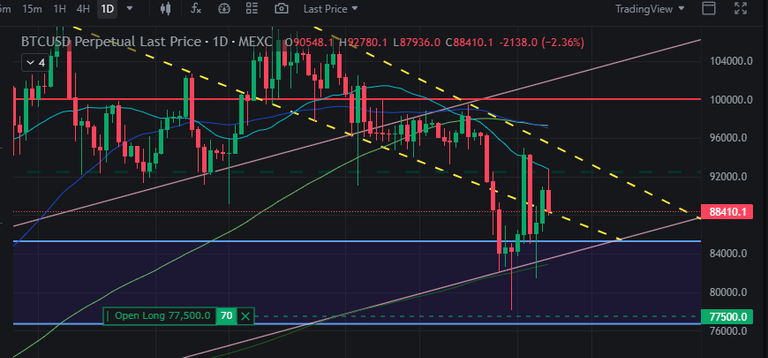
Looking at my personal chart we can see that I'm no longer the counter-trade indicator that I used to be. I longed the bottom last night and made some money today. I've been warning that this exact thing was going to happen for a while now (filling the liquidity void and the CME gap).
Five days ago I posted this:
I have rolled the bones, and the bones have spoken. We are so screwed on the short term.
This was one of my more impressive predictions recently considering the price was at that yellow support line and normally I would have went all delusional perma-bull in this situation. "Maybe we get a bounce?!?" Nope, not this time. Send it lower... and lower we went...
I repeated this same message on February 11th exactly one month ago.
The liquidity void and CME gap where a massive threat to the price.
I even showed with that orange circle exactly where I thought price might break down... and that's exactly where the price broke down.
So I am actually getting pretty decent at this day-trading thing it would seem.
Surprising I know.
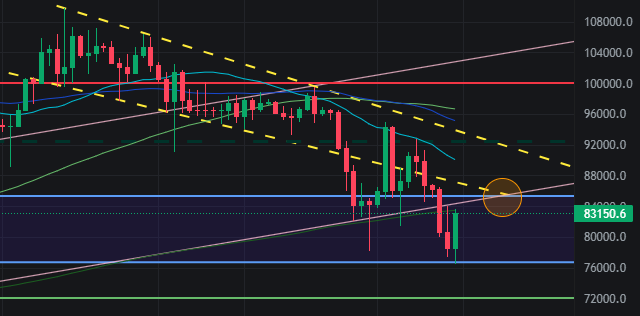
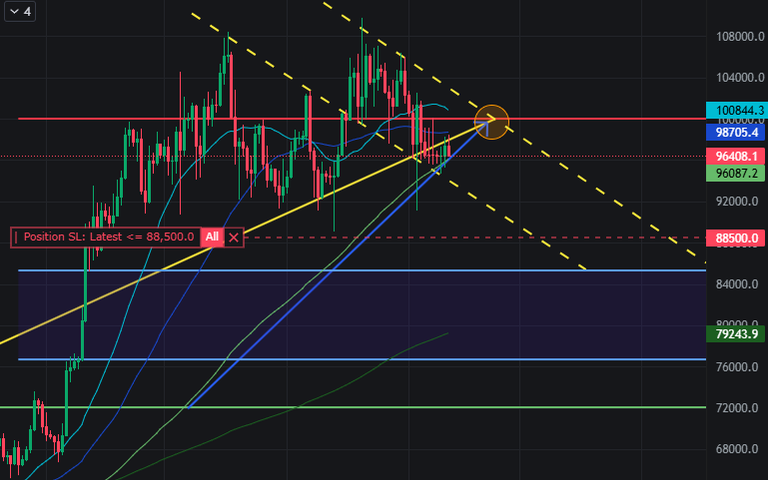
Back to the current chart:
There's now a new orange doom circle in town.
Three of my lines converge here.
The next bloodmoon and Mercury retrograde fall on Friday March 14th.
And now Jim Cramer is telling you to hodl... yikes.
We can also see that we've been batted down by the MA(25) teal line three times in a row. I'll basically be forced to short if we get back to around $88k... that's where a short squeeze would take us.

Heatmap
The leverage heatmap shows that a nice short squeeze puts us around $88k before there's a gap. The MA(25) is currently at $90k but declining quickly. If we end up trading anywhere near here in a day or two I'll have to throw in a quick short.
There's also the issue of trading under the MA(200). History shows that once this starts happening it usually doesn't stop for a while. This will lead to a death cross between the MA(25/200) and demoralize the market even further. But fear not, dear hodlers... it might not be so bad.
The four-year CAGR being 10% is honestly kind of insane. A Compound Annual Growth rate of 10% per year over four years is worse than the stock market. Remember that my "doubling-curve" is predicated in a CAGR of 100%. Many seem to think this is somehow bearish, but it's much more likely that spot buying anywhere in this area will be one of the most obvious buy-the-dip moments of all time.

The spiral chart shows...
After a four year period Bitcoin has NEVER crossed lower than it was prior. Price has continued exponentially up this entire time. Where was Bitcoin trading 4 years ago? You're going to love this but... exactly 4 years ago we were trading at $58k... lol. $58k was a huge milestone in both cycles, which is quite rare... unique even.
The above chart is only accurate up to Feb 24th so the line is even closer to the previous cycle. This is why I think that $72k is a likely bottom... assuming we haven't already bottomed yet. My guess that if the bottom isn't in it's coming VERY soon (Friday maybe). But take that with a grain of salt because I'm much better at predicting volatility than I am direction. We've also completely filled the gap that I said we were going to fill, so there is some hope that we don't bleed much more than we already have.

Conclusion
Cramer is the icing on top of the cake of fear. Fortunately no matter how bad it gets in the immediate short term I'm fairly certain this storm is going to clear by mid April and we'll be able to breathe a sigh of relief in a month. Until then keep sweating those bullets... because these omens are quite bad. Brace yourself for massive volatility on Friday and into the weekend.
i agree that we didn't reach the bottom of the cycle yet, but also i don't think we reached the top, what i think is that the bottom will b between nov2026 & jan2027, while the top between nov2025 & dec2025 although not sure how much low & how much high it will go- finally that's just what i think & anything can happen. have a great day
The guy is becoming reverse flash, he says one thing the reverse happens. Cramer saying to hold is almost a guaranteed dump at this point lol. The market just isn't matching his claims. Hopefully, we bounce back soon. Crypto has taking too much beating lately
I never get tired of the guy... at least being a meme
memelord even
I saw Cramer's "hot take" and felt my gallbladder twitch, then I remembered I don't have it anymore, and just felt depressed.
If the spiral chart model breaks, that would be mind-blowing.
I feel like if there is a tiny section of overlap it hasn't necessary "failed"
but yeah I agree with you it would be totally mindblowing.
I just moved some more HBD out of savings so I can take advantage of these low low Hive prices.
Kramer has spoken, the way is down! :)) Still believe we'll see BTC in the low 70s, and it seems a perfect level to start the climb up. Cheers! !BEER
Interesting, so beat time to possibly invest in Bitcoin is during these fed pivots. Don't tell anyone.
Well, Mr. Cramer, what do say to the fact that many of the big names in stocks sold out of much of their positions?
They like numbers like 33, 69 and 420 …
So maybe a low of 69,000 or 42,000 … or 33,000
Eventually a High of 690,000 or 420,000