So you're never buying then?
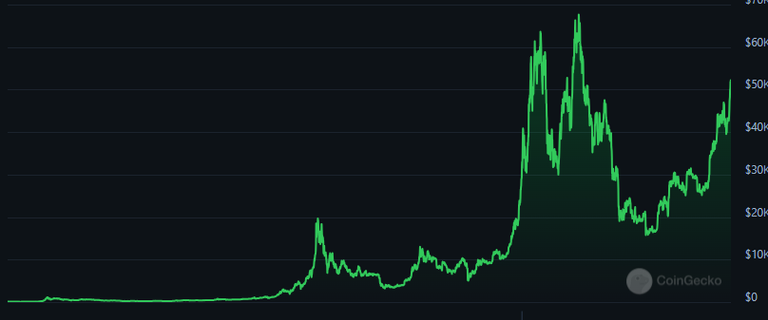
It has never not looked like this.
Only up.
$50k today is the same as $15k in 2020.
Right before it spiked to $40k and then $60k shortly after that.

It has never not looked like this.
Only up.
Right before it spiked to $40k and then $60k shortly after that.
I all depends on how far away anything is from the moving averages, and how long it hasn’t touched them.
Bitcoin is not always above the moving averages, sometimes it trades below them. Right now I would feel uncomfortable to buy it because it has been way above all the moving averages and has not touched them for a long time.
This has made me miss out on some impressive pumps but also saved me from buying tops.
I use the MA(25) MA(100) and MA(200) for a lot of my technical analysis as well.
The problem is that the ETF is outperforming anyone's wildest dreams and the exponential trendline is signaling that BTC is still oversold. I still think we get one more chance to buy in right after the overhyped halving event. After that it's quite unclear if we're going to get any good entry points.
Bitcoin only needs to dip 12% to hit the MA(25).
That's not a very big savings if it happens compared to the exponential gains on the table.
And the average is moving up quickly every day.
It's also weird to claim we haven't traded on these numbers for a "long time"
It's been a week since MA(25) and 2 weeks since MA(100).