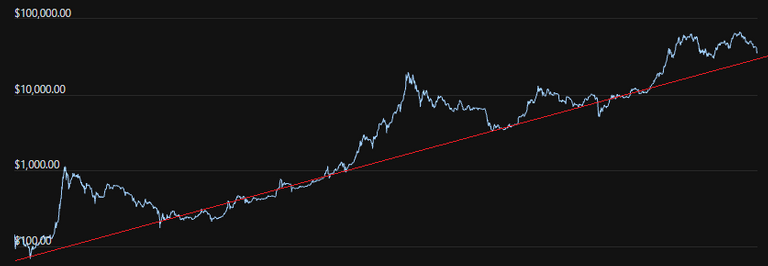
Long-term the logarithmic trendline is still 100% intact.
Bitcoin Doubling Curve
| 2013 | 2014 | 2015 | 2016 | 2017 |
|---|---|---|---|---|
| $100 | $200 | $400 | $800 | $1600 |
| 2018 | 2019 | 2020 | 2021 | 2022 |
|---|---|---|---|---|
| $3200 | $6400 | $12800 | $25600 | $51200 |
Current value of Bitcoin: $27k
2022 Bitcoin Doubling Curve
| Jan | Feb | Mar | April | May | June |
|---|---|---|---|---|---|
| $27733 | $29867 | $32,000 | $34133 | $36267 | $38400 |
| July | Aug | Sept | Oct | Nov | Dec |
|---|---|---|---|---|---|
| $40533 | $42667 | $44800 | $46933 | $49067 | $51200 |
New players don't want to enter BTC at these prices because it's deflationary.
The trendline for Bitcoin is painfully obvious.
It's just a straight line when we chart it on a logarithmic scale.

Given this painfully obvious trend, why would ANYONE buy at the idiot price?
For me the question is not why BTC is crashing back to the doubling curve, it's why did it get so bubbled in the first place given this information? We already know why. Both the Summer 2019 run and the Q4 2020 run was fueled by speculation revolving around institutional adoption and greed.
You make a great point:
Clearly it is not the supply side that is in trouble.
It's very clearly the demand side, which is quite interesting.
Why is demand low? Because the price is too high. That is all.
Doubling every year is a miracle.
I don't see a problem here: doubling price and adoption rate will take over the world in ten years.
$1 Quadrillion dollar market cap incoming in ten years at this rate.
Great comment @edicted. Thank you for sharing your data and perspective :)