The logarithmic Bitcoin price chart can provide us with important signals to consider in the long-term market, and precisely one of the most taken into account aspects is the interaction of the price with the 200-week Moving Average, since the interaction of the price with this indicator has already given reliable signals of bottoms in the market, opening opportunities for buying.

Source: Pexels.com.
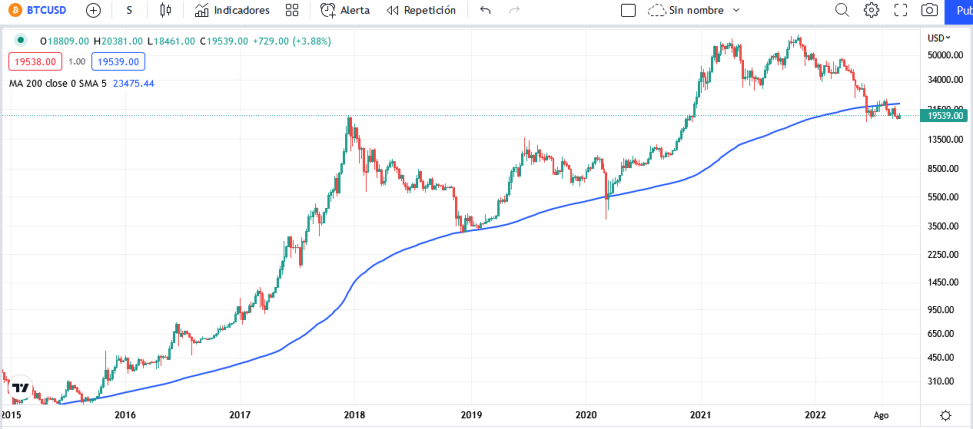
If we analyze the logarithmic price chart we can clearly notice that the BTC price has very rarely reached the 200-week moving average line (blue line), and on the occasions that it has done so we see the formation of the bottoms in the bear markets of the past.
Source: Screenshot taken from Tradingview.com.
As we can see in the image above, except for the current condition, historically the weekly candlesticks barely close below the indicator line, which is why the 200-week Moving Average had been considered a solid bottom indicator in the market, providing an excellent buy signal as it has subsequently seen impressive price increases.
Source: Screenshot taken from Tradingview.com.
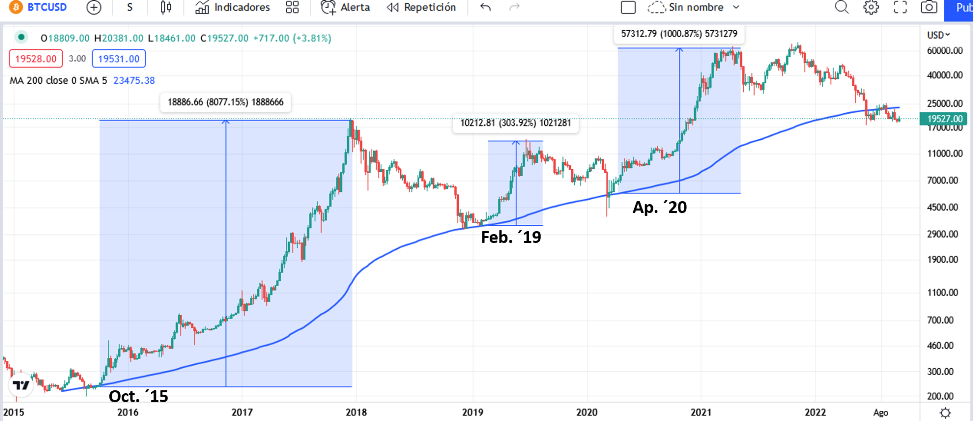
In the image above we can see how after the bottom reached in 2015 there was a continuous growth that increased almost 8000% the prices from the October 2015 rebound to the December 2017 peak. Then after the 2019 bottom there was an increase of almost 300%, and in 2020, after the bottom reached in April by the post-covid crash, there was an increase of almost 1000%, bouncing from $5600 to almost $60,000.
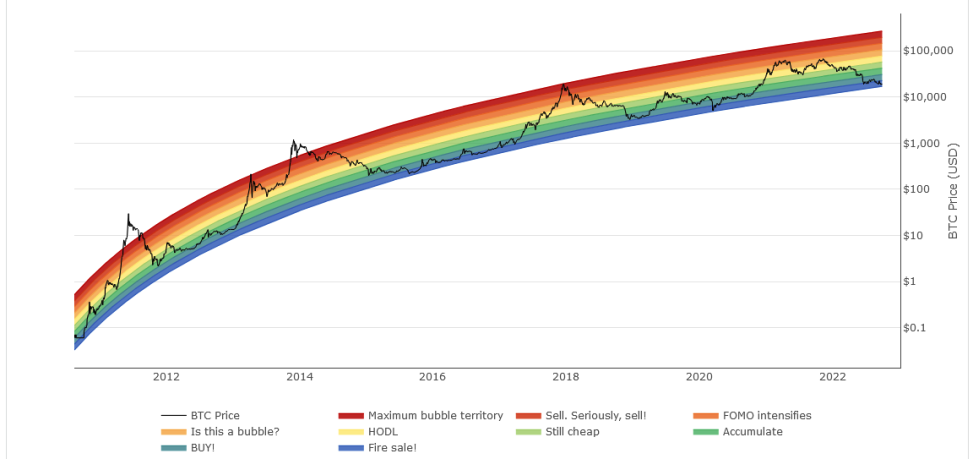
This historical behavior of reaching a bottom in the market when prices reached the 200-week Moving Average line was supported by another chart, the so-called Rainbow Chart, which is a tool used to visualize the long-term Bitcoin price action based on a function of market sentiment based on a color scale.
Source: Screenshot taken from lookintobitcoin.com.
As we see in this interesting chart, in previous bear markets, the BTC price always reached up to the blue or purple rainbow line, signaling great buying opportunities. And just now the price has reached the purple line of liquidation selling.
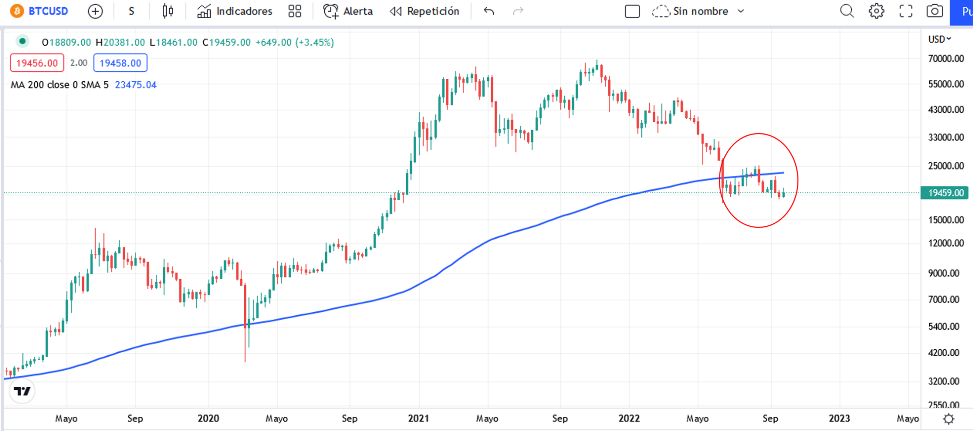
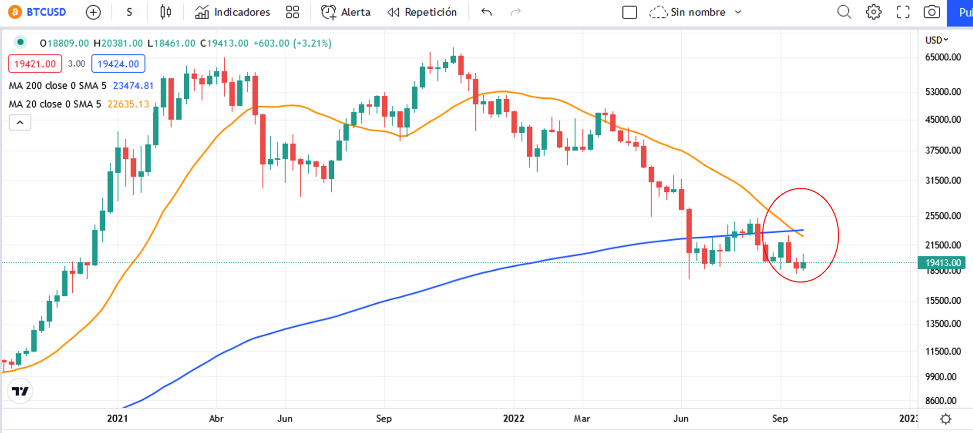
However currently the situation is somewhat different, as we have observed on the weekly price chart, prices have failed to hold the level of the 200-week Moving Average, and fell below this level for the first time in history in June this year, and the attempt in mid-August to bring prices back above the indicator line was rejected.
Source: Screenshot taken from Tradingview.com.
Another signal that sets off alarms comes from another MA, in this case the 20-week MA, and that is that this medium-term indicator has just crossed below the 200-week MA for the first time in history.
Source: Screenshot taken from Tradingview.com.
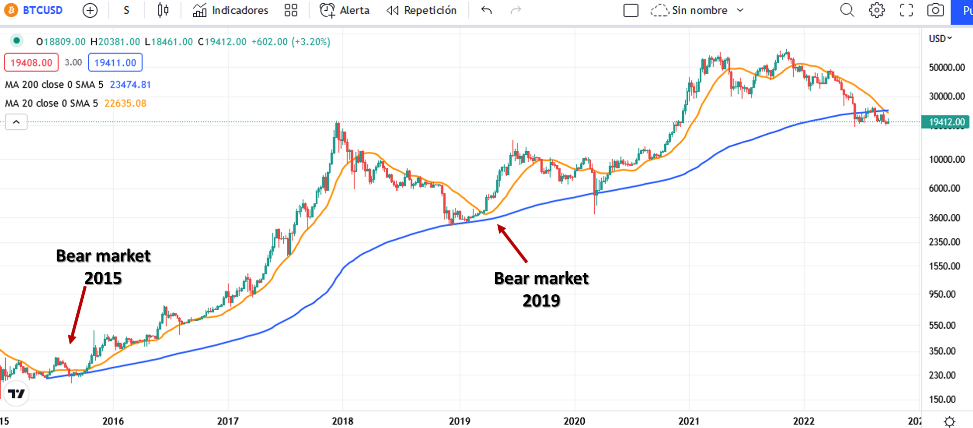
In the past these lines had never crossed, neither in 2015 nor in 2019 when they made their maximum approaches, which as we can also notice, after these approaches occurred there was an important growth in the price, as we can see in the following image.
Source: Screenshot taken from Tradingview.com.
The truth is that in the past these signals have indicated absolute bottoms in the market, and later there were important bull markets, and today we must interpret this death cross that is occurring for the first time in history.
Well friends, we must also keep in mind that these moving averages are lagging indicators that can hardly give us a prediction of the future, so it is very important to be attentive to what may happen next. See you next time!
Posted Using LeoFinance Beta
I can't wait for the next few weeks and what will happen. I hope it won't be as bad
!1UP
We are waiting in the wings, let's hope to see the BTC recovery soon
You have received a 1UP from @kwskicky!
@leo-curator, @vyb-curator, @pob-curator
And they will bring !PIZZA 🍕. The @oneup-cartel will soon upvote you with:
Learn more about our delegation service to earn daily rewards. Join the Cartel on Discord.
The campaign aims to onboard new application developers to grow our ecosystem. If you missed the presentation, you can watch it on YouTube.
You cast your vote for the proposal on Peakd, Ecency, or using HiveSigner.
Thank you!Dear @emiliomoron,May I ask you to review and support the Dev Marketing Proposal (https://peakd.com/me/proposals/232) we presented on Conference Day 1 at HiveFest?