This weekend we saw the Bitcoin price gain some upside momentum, but unfortunately it was short lived and quickly the bears took control.

Source: Wikimedia.org.
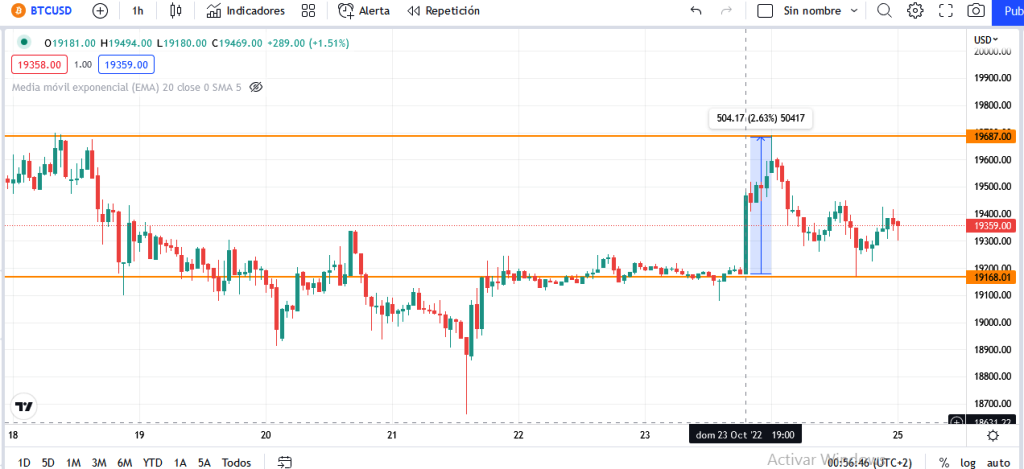
This Sunday, October 23, the BTC price recorded a considerable boost in a matter of a few hours, with the price soaring from $19176 to $19692, however a reversal in the price action was soon seen pulling back to the $19300 level, such that the price seems to have respected this $19600 level as a resistance on the short-term Bitcoin chart. And by the time of this publication, Bitcoin was trading at $19359, and it can be noted how the $19150 level acts as an important price support on the daily chart.

Source: BTC/USD 1-hour chart. Source: Screenshot taken from Tradingview.com.
And what could be the reason for this movement?
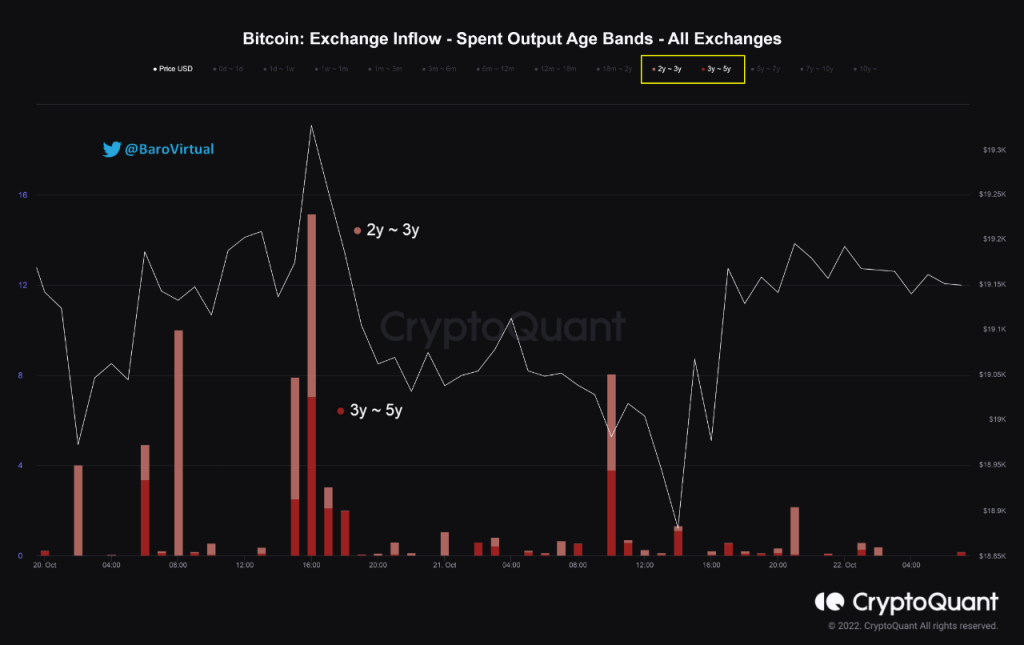
One possible explanation for this movement may be due to the fact that recently there have been deposited in Bitcoin exchanges that have not been moving for some time, according to the Exchange Inflow chart published by CryptoQuant we can see how specifically Bitcoin aged between 2 to 3 years and 3 to 5 years; and such movements generally influence the short-term market negatively.

Bitcoin: Exchange Inflow - Spent Output Age Bands. Source: Cryptoquant.com
BTC continues to consolidate
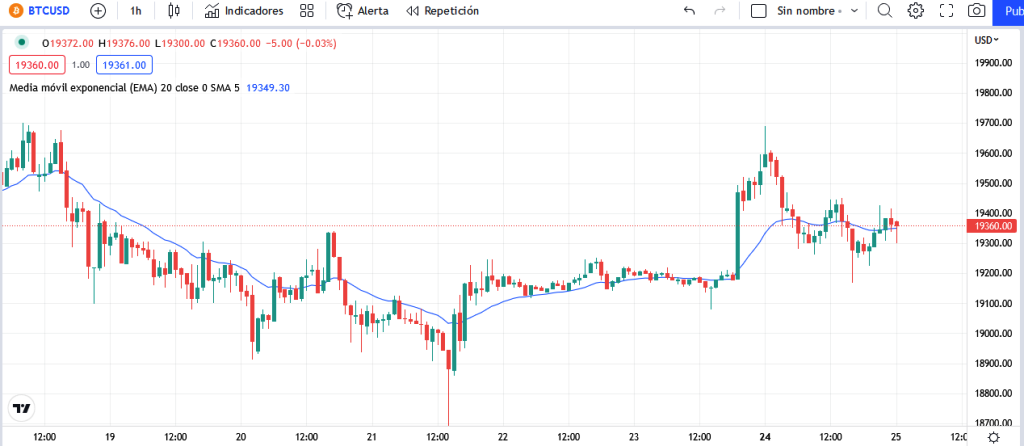
The Bitcoin price has been consolidating since its fall in mid-June, and although there has been this interesting move, we see that the price is still struggling to stay above the 20-day EMA.

Source: BTC/USD 1-hour chart. Source: Screenshot taken from Tradingview.com.
So we should expect a more sustained push to keep the price above this region to push the price to another level, as for now the resistance to overcome is at the $19600 level, breaking this resistance could take the price to a more significant level, being able to retake perhaps the $20,000 level. Although of course, another drop is always something to keep an eye on.
Well friends, let me know what you think in your comments. See you next time!
Posted Using LeoFinance Beta