Japanese candlestick chart
In trading, there are several charts used for analysis the data. Basically, these charts are required for technical analysis of trading data. The readers can have the picture of trading info at a glance from the chart. Candlestick chart is composed of candles over a specific period of time. It is also called the Japanese Candlestick Chart. This chart is representing the opening and closing price over a period of time at a glance. We can also check the high and low price of that specific currency for a specific period of time in case of trading.
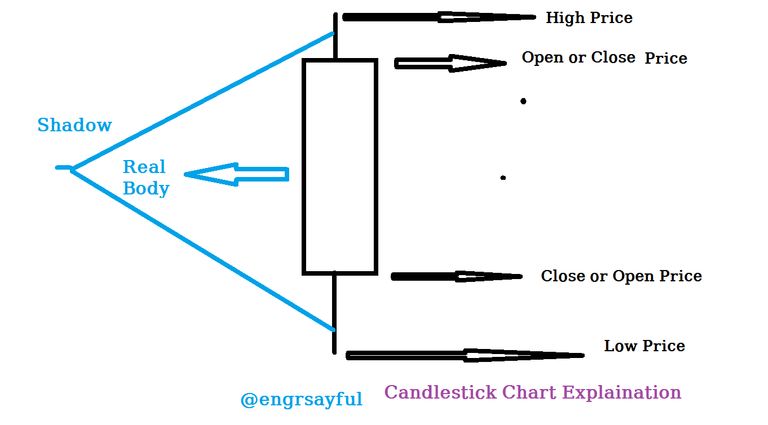
Candlestick chart gives us the greater picture of the price change to analyse the trend including low, high price. Here are the basic components of a candlestick charts you can see in the following picture.

- Open: Open is the opening price of the currency or asset over a specific time period. In bullish market it’s in the bottom of the candle and in bearish market its in the top of the candle.
- Close: Close is the closing price of the currency or asset over a specific time period. In bullish market it’s in the top of the candle and in bearish market its in the bottom of the candle.
- High: High line of shadow indicates the level of price change upto high level.
- Low: Low line of shadow indicates the level of price change upto low level.
- Real Body: Real body of the candle indicates the gap of open and close price
- Shadow: Shadow indicates the high and low level of price change from open and close price over specific period of time.
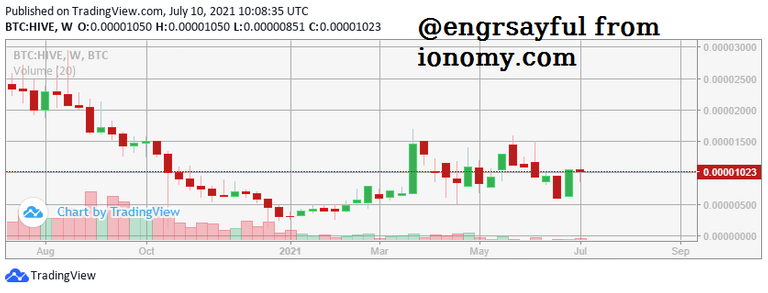
To have the greater picture about candlestick chart, I am just showing real candle chart from exchange and you can easily see the opening, closing and high, low price of hive against BTC for last year.

Bearish Candle and Bullish Candle
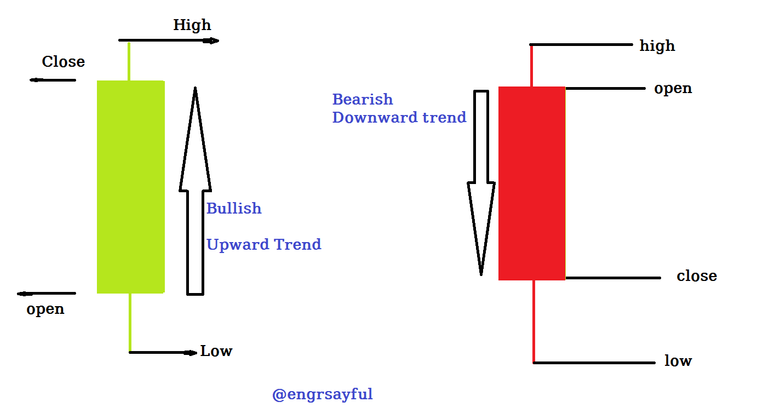
In the bullish market, we can see those green candles because the opening price is low and closing price is high. And in bearish market we can see the reverse as it opens with high price and closes with low price. From this opening and closing price point of view, we can find the bullish and bearish candles in the candlestick.

- Bullish = Up Movement = Bulls = Buy = Long
- Bearish = Down Movement = Bears = Sell = Short
If you just follow the picture of the anatomy of bearish and bullish candle, then you can easily understand what is the bullish market in the candlestick and what is the bearish market of the candlestick.

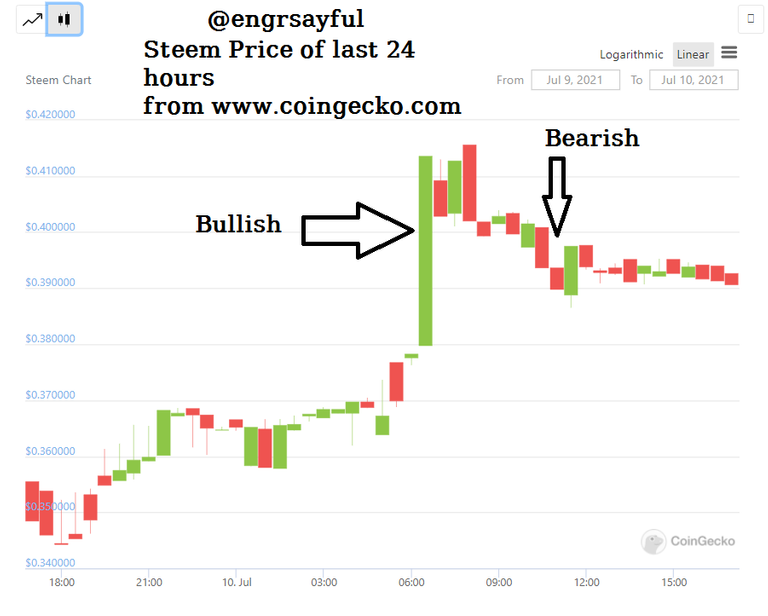
Here is the example of real-life trading chart of candlestick which is just showing you the real picture of bearish and bullish candles in the candlestick charts. I hope from the picture, anyone can come to know about bearish candle and bullish candle in practical way.

Who I am

This is Sayful
Ex Banker
Part time blogger
By Profession Lecturer
Fasinated by Nature and Cricket
Day dreamer and a round pig in square hole
Write on Textiles, Online Money Making, Agriculture & Technology

Upvote, Reblog and Follow me on hive @engrsayful


This is Saiful’s Classroom from @engrsayful
Find me on
Posted Using LeoFinance Beta
Ex Banker
Part time blogger
By Profession Lecturer
Fasinated by Nature and Cricket
Day dreamer and a round pig in square hole
Write on Textiles, Online Money Making, Agriculture & Technology

Upvote, Reblog and Follow me on hive @engrsayful


This is Saiful’s Classroom from @engrsayful
Find me on
Posted Using LeoFinance Beta
Nice information.i am a full time forex trader and a scientist. I trade forex. The information is good.
But I started using Japanese candle stick before I added heiki,both of them for confirmation.
Thanks for the information
Posted Using LeoFinance Beta
If you analyse the price chart and trend with candlestick then it will be a better way for you to take the decision about the price and other data
I am a full trader,I trade with different strategy,
Posted Using LeoFinance Beta
Congratulations @engrsayful! You have completed the following achievement on the Hive blockchain and have been rewarded with new badge(s) :
Your next target is to reach 6000 replies.
You can view your badges on your board and compare yourself to others in the Ranking
If you no longer want to receive notifications, reply to this comment with the word
STOPCheck out the last post from @hivebuzz:
Getting much more statistics nowadays. It's wonderful to get such a huge number of replies from my followers and friends. I want to go long distance