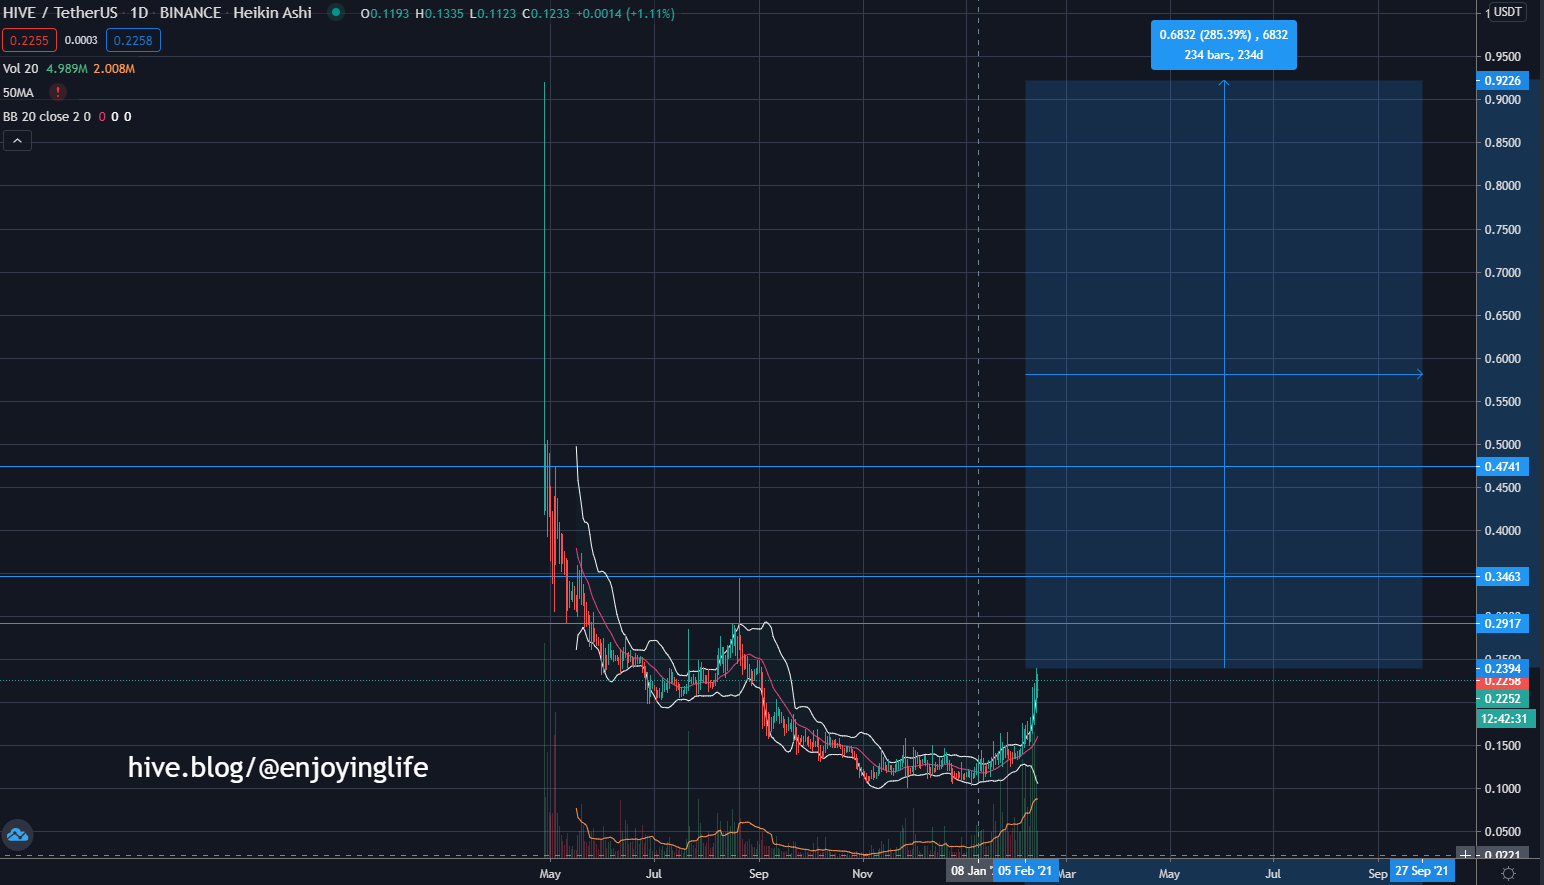
Hive recently broke out of a 10 month long downtrend. Seems like some exciting times are on the horizon for Hive holders.
Looking at daily Hive/USDT chart, we can extract the following data:
Strong volume coming in during the last few weeks, growing exponentially last week.
Hive broke out above all moving averages and is currently traded above upper trend of Bollinger Bands.

This usually means the currency is overbought but under these conditions (crypto breaking 1 Trillion MC) it means that bullseason is starting for Hive.
Some explosive move should occur sooner than later!
There are 3 minor resistances marked on the chart, sitting at 0.29 0.34 and 0.47 respectively. Once these are flipped, they should serve as a launchpad for Hive to fly towards all time highs. (and further)
Hive seems like an amazing investment for 2021. Maybe this is the time for FOMO to kick in.
Stochastic RSI, RSI and OBV are all showing the same, continuation of an uptrend. On balance volume is one of the best indicators out there to precisely show you the money flow. Observing Hive OBV we can quickly notice how something is cooking...

Hive is already on a strong bullish run, and what might look like Top too inexperienced traders will be a entry point for the experienced ones.
One more question, that boogles my mind is, how packed are Justin Sun and CZ Binance with Hive bags? Considering they played a huge role in this perfect Hive correction that started the day it listed on Binance :D
I guess we'll see. If we spot some gigantic sell pressure on the way to the top, you can know for sure Justin is trying to stick it to ya with his buddies. Lol
Posted Using LeoFinance Beta