Hello everyone, there is this technique that you can only use in the crypto world, you can't use it for stocks but this can give you an advantage as a trader or investor, it's called on-chain analysis. Today I'm going to share with you everything you gotta know about on-chain analysis.
You must have heard about technical analysis before. That is when people on youtube or twitter show you their fancy charts with squiggly lines and predict where the price of bitcoin or some other coin is headed next but on-chain analysis is totally different from TA. It has more to do with fundamentals because we are looking directly at the treasure trove of data that the blockchain offers us for insights.
What is On-chain Analysis
The beauty of blockchain is that it is an open ledger that anyone in the world can take a look at. We can see the current transactions and blocks floating around of course, but we can also view all of them throughout history all the way up to the first block that satoshi ever mined. You may be surprised at how rich the info is that we could get our hands on. For example, we can see all the miners wallets, and if they are selling or holding the amount of bitcoin that each address holds the amount of fees included in each block, how many new addresses are appearing every day, how long do people hold their bitcoin before moving it, how many total transactions were sent on any given day. This is just a small sample of all the data you can get from looking at the blockchain but I hope it kind of gives you an idea of the power of knowing this info. You can use this data to get a sense of the overall sentiment, see how investors are behaving on a larger scale. You can compare how these metrics correlated with price in the past so we can make educated guesses about price action in the future because we do have the historical price data after all so we can just overlay that chart on top of a chart of any of these metrics that I just mentioned. Lastly, we can use it to measure the overall utility of the bitcoin network because remember bitcoin is not only for speculation. That is a part of it of course but people actually use the network to send like payments so this on-chain analysis helps us divorce the raw utility value of the network from the speculative value.
Examples of Metrics
There are simple ones like a number of active addresses or number of transactions being sent but you can get fancy here and combine them to create models or ratios to get even deeper insights.
RHOLD Ratio
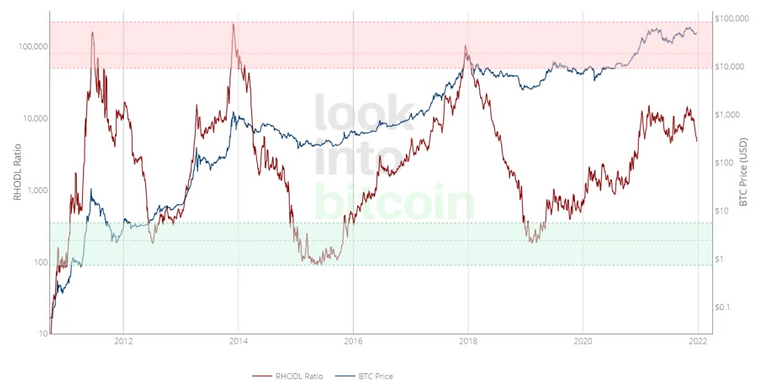
This compares the amount of bitcoin that has been held for one week versus the amount that has been held for one to two years. When this ratio gets high that means there is a lot more short-term holders and the market may be overheated.
MVRV Ratio
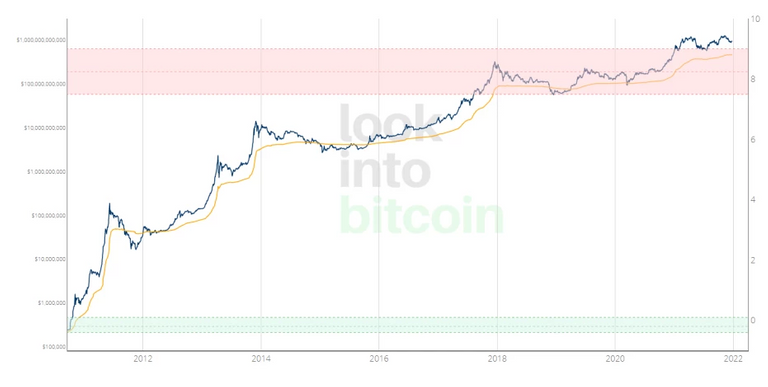
This one compares bitcoin's current market cap to its realized value. Realized value is just where you take when each bitcoin was last moved take the price on that day and add it all up and do an average. When the market value is significantly above the realized value that can mean that price is overheated.
How do you view these?
There are some free sites like "look into bitcoin" or "woobull" sites.
https://www.lookintobitcoin.com/
Then if you want to get real fancy you could pay for some premium services like glassnode or cryptoquant. The benefit of those is that they used advanced machine learning.
Hope you found today’s article helpful. If you want to learn more about trading follow me at @fizzonmyjayyce. Have a nice day :)
Posted Using LeoFinance Beta