
Direct from the desk of Dane Williams.
I don't normally include tight triangles with trend lines like this on my charts because they get chopped so easily.
But with Gold sitting right on support and the triangle being so obvious even without drawing it, I just threw it on.
Take a look at the higher time frame chart below and you'll soon see what I mean.
XAU/USD Daily:
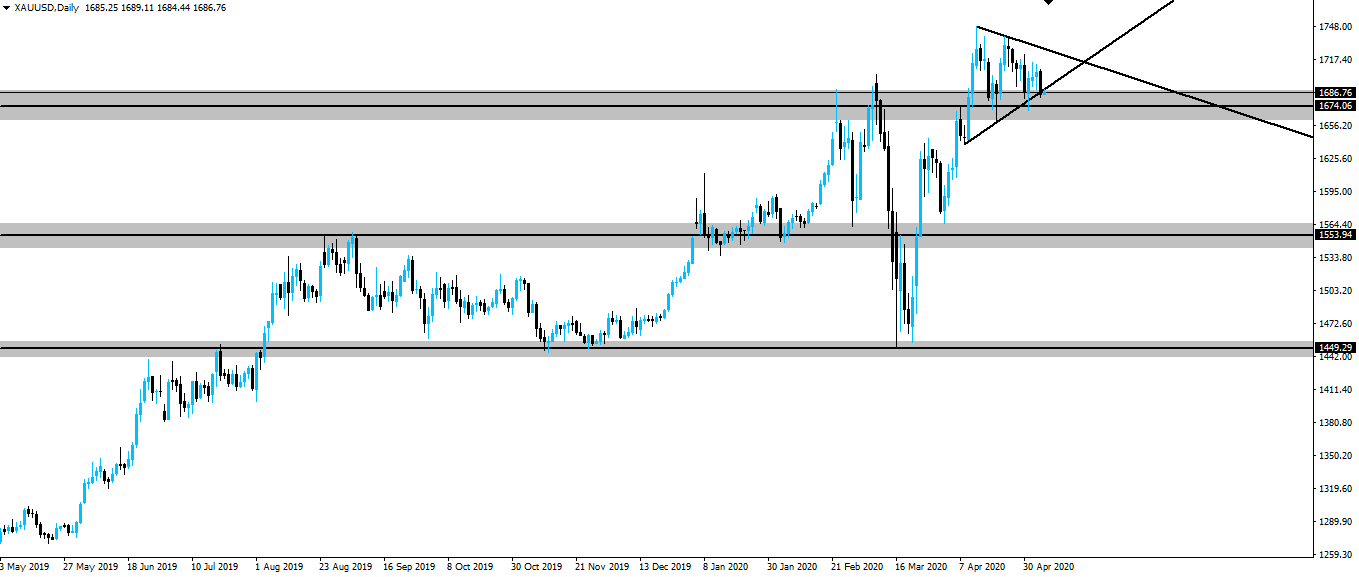
Here are a few quick, high level thoughts on this one.
- Gold is finding buyers at previous support turned resistance.
- Bitcoin is already ripping.
- Indices showing weakness at resistance.
Now zoom into an intraday chart such as an hourly and take a look for previous short term resistance turned support in order to buy off.
There's actually a really juicy zone that you can't miss.
Almost obvious enough to get me to start writing my daily email again...
Best of probabilities to you,
Dane.
FOREX BROKR | Hive Blog
Higher time frame market analysis.
Posted Using LeoFinance
Well spotted. I am a gold bug but I hadn't seen this clear pennant formation. Another week or two and we should get a decent move. Hopefully its up!
What’s the go with the gold community here on Hive? I used to use the #steemsilvergold hashtag, but it obviously doesn’t work here.
Where do you ‘bugs’ hang out? 😉
The community is called Silver Gold Stackers. You can find it HERE and the tag we use on HIVE is #SilverGoldStackers
We haven't got everyone signed up to the community yet and there are still some laggards on STEEM along with some cross-posters on both platforms, but the community is here.
Thank you for the heads up!
Yay! I'm waiting for the move.
And Silver should follow even stronger.